Description
The 2018 Fleet Deployment Report is a 85-page PDF providing cruise market overview with fleet deployment statistics (capacity data) and trends for each major cruise line, as well as niche, luxury and expedition operators, including past data.
It is the only forward-looking, independently-researched brand level deployment data available.
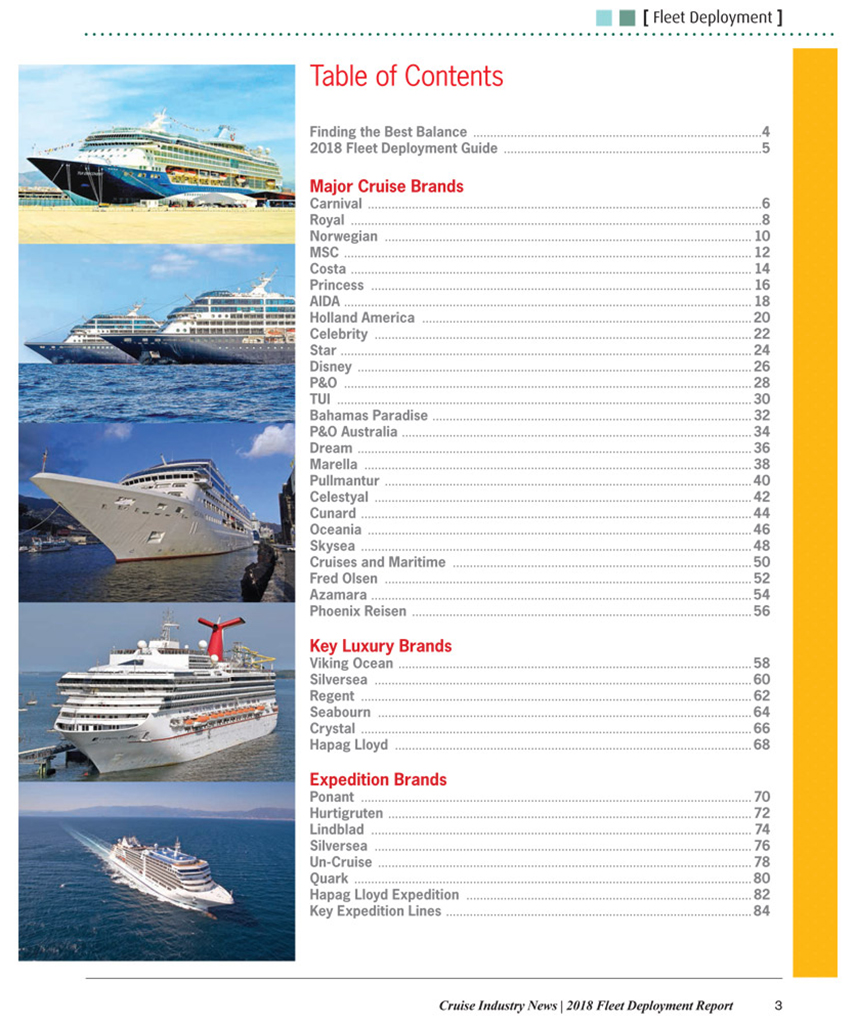
Click here to see the Table of Contents and Sample Pages.
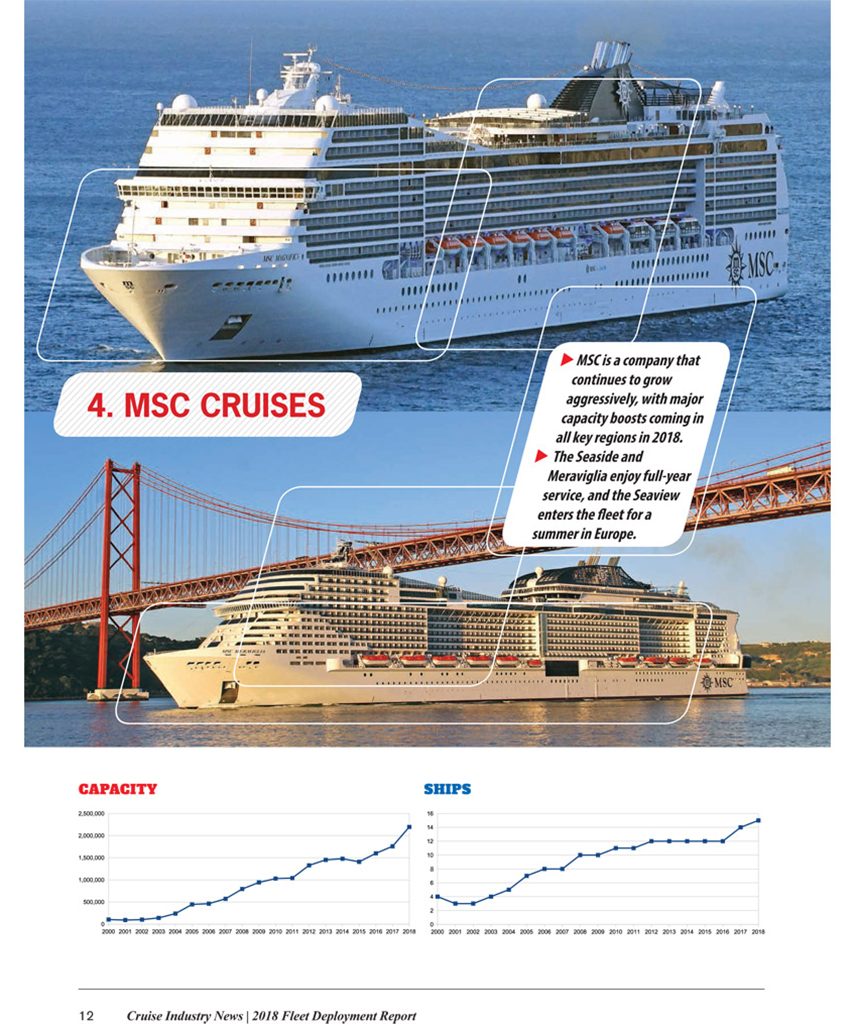
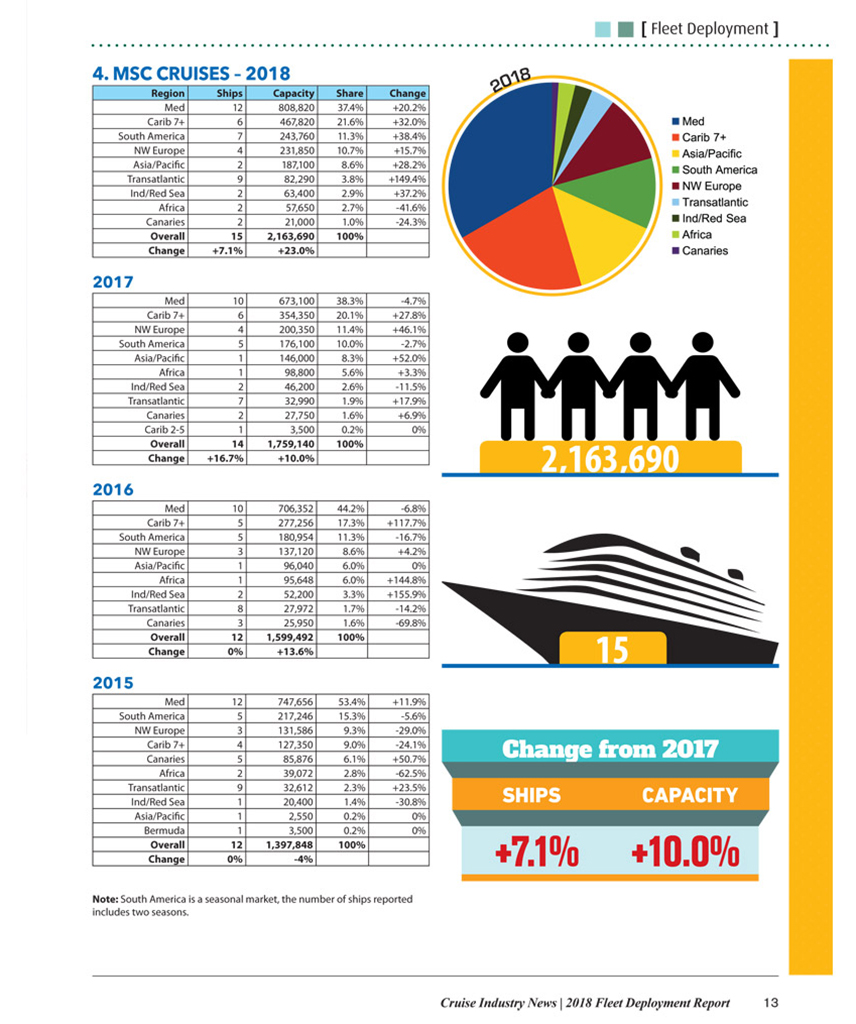
The report covers the top 25 cruise brands globally by capacity, and the top luxury and expedition operators by capacity, with data from 2015 through 2018, with each year broken down by sailing region (market) per brand based on independent research from Cruise Industry News.
Click here to order and download instantly.
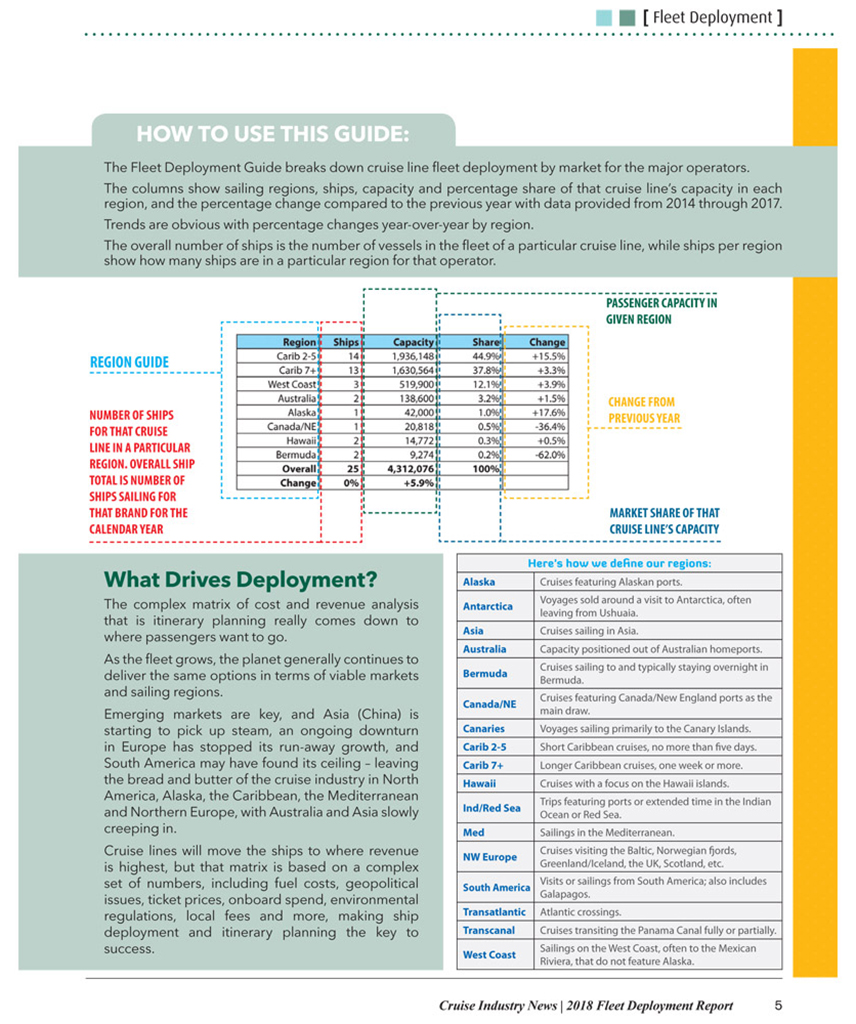
- See trends, regional deployment, ship statistics, percent changes and much more.
- Data from 2015 to 2018.
- Broken down by cruise line and sailing region (market) – easy to read and interpret data. See how a cruise line’s deployment has changed by region over three years, by percentage share of its fleet, ship and capacity.
- Original statistics by Cruise Industry News – © 2017 Cruise Industry News.