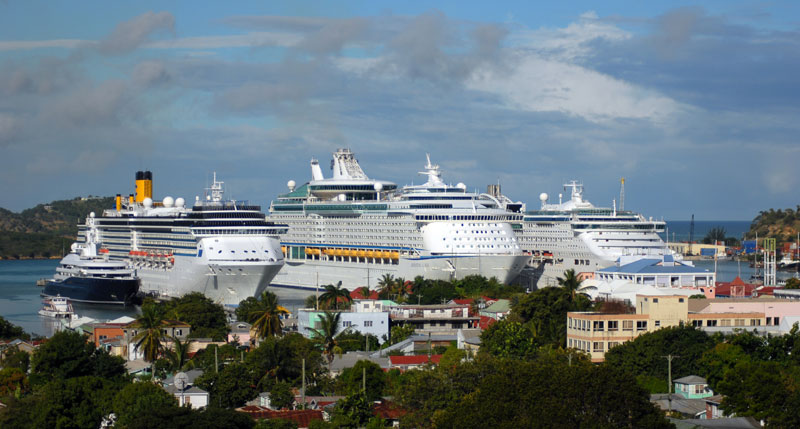
 The Caribbean maintains its position as the most popular cruise destination in the world, capturing more than 40 percent of all the passengers, despite the build up in the Mediterranean, South America and Australia.
Caribbean port authorities and tourism officials have taken up the challenge by upgrading their facilities and building new ports to accommodate the largest of the new ships.
|
The latest example is Falmouth in Jamaica, partially built on land reclaimed from the ocean, and in the process of being recreated in the image of a bustling rum and sugar trading town of 150 years ago. All across the Caribbean, destinations are responding to industry growth with improved and expanded infrastructure, although as one port official told Cruise Industry News, “cruise lines must remember that they (the island) are not Dubai.” “Falmouth will give us a boost and the Caribbean too,” said William Tatham, vice president of cruise shipping and marina operations for the Jamaica Port Authority. “We need to reinvent and reposition ourselves and Falmouth is the start.” And that may be happening. At press time, Barbados was in the final stages of a bid for the expansion and redevelopment of its cruise pier, according to Ryan Blackett, director of cruise. There are also plans to build new piers in St. Kitts and Nevis, Curacao and Aruba. Other upgrades are underway in Guadeloupe, Martinique, the Dominican Republic and Puerto Rico. But is there an Oasis syndrome? Some expansion projects are designed to accommodate Oasis-class ships, but it was pointed out that there are only two Oasis-class ships, so it does not make sense for too many ports to gear up for that size. “We (the Caribbean) are the most tourism dependent region on the planet,” commented Hugh Riley, secretary general of the Caribbean Tourism Organization, at a panel discussion in New York in February. 2010 broke both cruise passenger records and overall tourist arrivals in the Caribbean, but revenues were down to 2004 levels, according to Riley, who added that the hotels were “doing nonsense (in terms of pricing) to get people on planes.” With more ships, the trend line continues up as Cruise Industry News estimates a record-breaking 7.5 million passengers in the region for the calendar year 2011, up 1.4 percent from last year. However, the high season is shorter as more ships extend their summer season into late fall in Europe (and then go back earlier than ever) where yields are higher. The bulk of the cruise business in the Caribbean is happening in just four months, which also raises the level of competition (and congestion) among the islands. Cruise line executives are quick to point out congestion issues in some of the main Caribbean destinations, both in terms of too many ships in port and too many people shoreside. “There needs to be more homeporting in San Juan,” said Edward Thomas, president and CEO of WICO in St.Thomas. “That would mean a better distribution of ship calls during the week. Currently, almost all the calls come from the mainland and everyone gets here on Tuesday or Wednesday.” Excerpt from Cruise Industry News Quarterly Magazine: Spring 2011 |
2011 Caribbean Capacity Source: 2011 Cruise Industry News Annual Report – Pre Order Today!
|


