Lindblad Expeditions Holdings today reported financial results for the quarter ended September 30, 2019.
Sven-Olof Lindblad, President and Chief Executive Officer, said: “Lindblad delivered another quarter of strong financial growth and sustained operating momentum this past quarter as the strategic investments we have made to expand our capacity are being met by the robust demand for high quality and immersive adventure travel. Over the past two years we have dramatically increased the available berths across our fleet and, as we have added inventory, we have also been able to grow Occupancy and Net Yields.
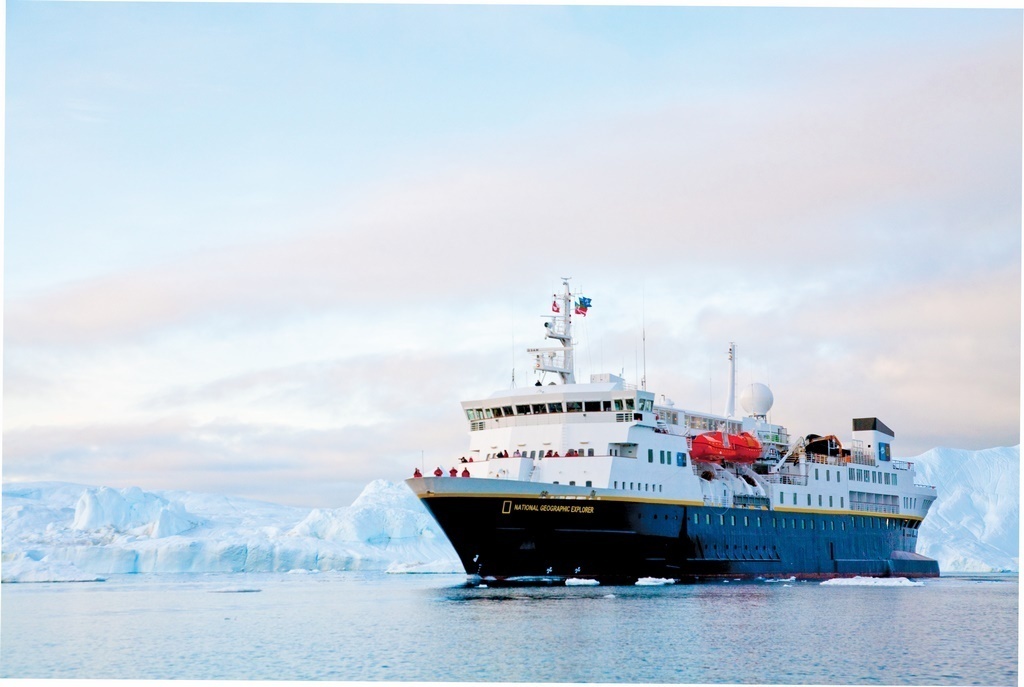
“At the same time, bookings for future travel have remained strong for both our existing ships, as well as for our two new state of the art polar builds, the National Geographic Endurance, scheduled for delivery in 2020, and the recently named National Geographic Resolution, scheduled for delivery in 2021. With continued demand from loyal past guests and a rapidly growing population of new travelers looking for unique expedition experiences with a proven operator, we are well positioned to create additional shareholder value in the years ahead.”
Third quarter tour revenues of $101.0 million increased $13.7 million, or 16%, as compared to the same period in 2018. The increase was driven by growth of $12.1 million at the Lindblad segment and $1.7 million at Natural Habitat, the company said.
Lindblad segment tour revenues of $76.6 million increased $12.1 million, or 19%, compared to the third quarter a year ago primarily due to a 14% increase in Available Guest Nights, mostly from the launch of the National Geographic Venture in December 2018.
The year on year growth also reflects a 7% increase in Net Yield to $1,054 due primarily to higher pricing and changes in itineraries, as well as an increase in Occupancy to 94%.
Natural Habitat revenues of $24.4 million increased $1.7 million, or 7%, compared to the third quarter a year ago due primarily to higher ticket revenue from additional departures and increased pricing.
Net loss available to common stockholders for the third quarter was $0.5 million, $0.01 per diluted share, as compared with net income available to common stockholders of $5.1 million, $0.11 per diluted share, in the third quarter of 2018.
The $5.6 million decrease primarily reflects improved operating results that were more than offset by a $4.7 million increase in income tax expense, a $2.7 million non-cash deemed dividend related to completing the warrant exchange, a $2.3 million loss on foreign currency and a $1.2 million increase in depreciation and amortization due largely to the addition of the National Geographic Venture to the fleet in December 2018.
Third quarter Adjusted EBITDA of $24.1 million increased $7.0 million, or 41%, as compared to the same period in 2018. The increase was driven by growth of $5.9 million at the Lindblad segment and $1.1 million at Natural Habitat.
Lindblad segment Adjusted EBITDA of $20.6 million increased $5.9 million, or 40%, as compared to the third quarter a year ago as the increased tour revenues were partially offset by operating costs on the National Geographic Venture. The third quarter also included increased costs due to higher marketing spend to drive long-term growth initiatives, higher commission expense related to the revenue growth and increased personnel costs partially offset by lower value-added tax expense.
Natural Habitat Adjusted EBITDA of $3.5 million increased $1.1 million, or 43%, as compared to the third quarter a year ago as the revenue growth was partially offset by increased operating costs related to additional departures and higher marketing and personnel costs to drive long-term growth initiatives.