Lindblad Expeditions Holdings today reported financial results for the quarter ended March 31, 2019.
First quarter tour revenues of $89.7 million increased $7.2 million, or 9%, as compared to the same period in 2018. The increase was driven by growth of $5.6 million at the Lindblad segment and a $1.7 million increase at Natural Habitat, the company said.
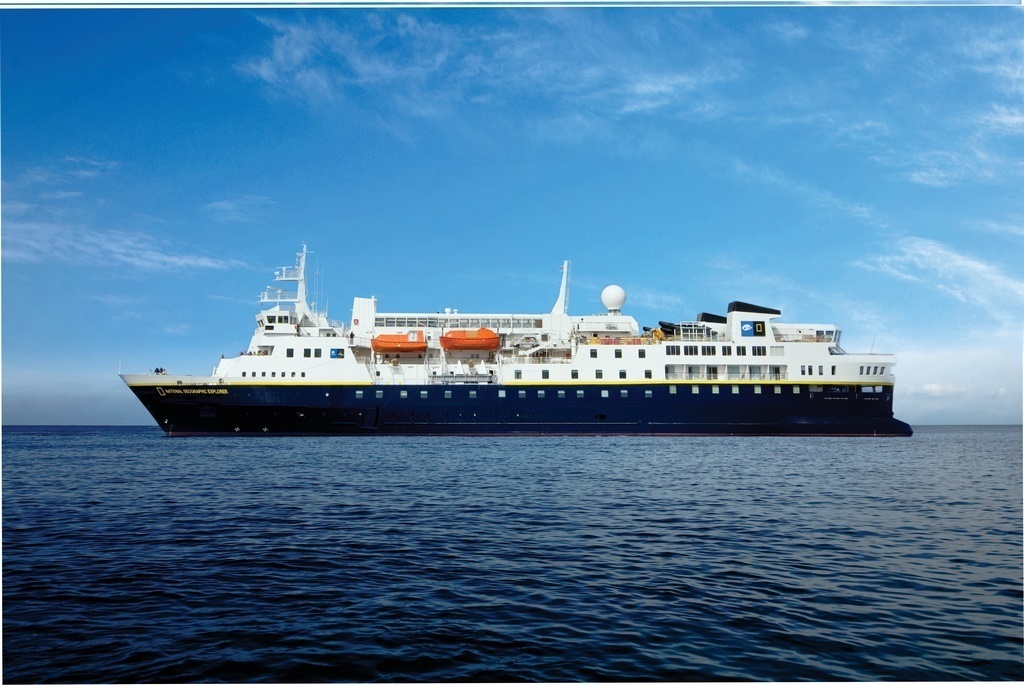
Sven-Olof Lindblad, President and Chief Executive Officer, said” “Lindblad is off to another great start in 2019 as the strong momentum we generated throughout the last year and a half continued into the first quarter. The addition of our second new build vessel, the National Geographic Venture, in December of 2018, has further increased our overall capacity and as we have expanded our inventory we continue to maintain high yields and occupancy levels.
“Demand for expedition travel has never been greater and with a proven track record of delivering high quality and immersive experiences, along with our long-standing partnership with National Geographic, we are generating booking strength from both loyal guests as well as those experiencing this type of travel for the first time,” he continued. “Reservations for departures later this year and beyond remain strong as we continue to see broad based demand at higher yields for our new builds as well as our existing fleet. With further capacity expansion, including two new polar vessels scheduled to join our fleet over the next two years, and the ability to sustain pricing and occupancy levels, we remain uniquely positioned to generate continued strong growth and build additional shareholder value for years to come.”
Lindblad segment tour revenue of $76.0 million increased $5.6 million, or 8%, compared to the first quarter a year ago primarily due to a 9% increase in Available Guest Nights, mostly from the launch of the National Geographic Venture in December 2018. The growth in Available Guest Nights, as well as a slight increase in Occupancy to 91%, was partially offset by a 2% decrease in Net Yield to $1,099 as increased pricing was offset by itinerary changes.
Natural Habitat revenues of $13.6 million increased $1.7 million, or 14%, compared to the first quarter a year ago due primarily to higher ticket revenue from additional departures and increased pricing.
Net income available to common stockholders for the first quarter was $14.7 million, $0.31 per diluted share, as compared with net income available to common stockholders of $10.8 million, $0.24 per diluted share, in the first quarter of 2018. The $3.9 million increase primarily reflects a $3.1 million tax benefit during the first quarter of 2019 versus tax expense of $0.3 million during the same period a year ago.
The year on year increase also includes $0.7 million in foreign currency gains in the current year as compared with $0.5 million in foreign currency losses in the first quarter of 2018, as well as the absence of $1.0 million in costs related to refinancing the Company’s credit facility during the first quarter a year ago. These increases were partially offset by $1.1 million in higher depreciation and amortization primarily due to the addition of the National Geographic Venture to the fleet in December 2018.
First quarter Adjusted EBITDA of $22.0 million decreased $0.1 million, or 1%, as compared to the same period in 2018 with a slight increase at the Lindblad segment more than offset by a $0.2 million decrease at Natural Habitat.
Lindblad segment Adjusted EBITDA of $20.9 million increased slightly as compared to the first quarter a year ago as the tour revenue growth and lower drydock and land costs were mostly offset by operating costs on the National Geographic Venture. The first quarter of 2019 also included higher marketing spend to drive long-term growth initiatives, increased commission expense related to the revenue growth and higher personnel costs.
Natural Habitat Adjusted EBITDA of $1.1 million decreased $0.2 million compared to the first quarter a year ago as the revenue growth was more than offset by higher operating costs related to the additional departures and increased marketing and personnel costs to drive long-term growth initiatives.