
Page 27 - 2019 Cruise Industry News Annual Report
P. 27
[ Europe ]
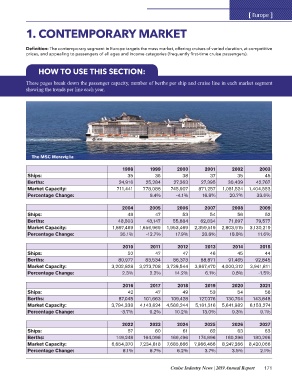
1. CONTEMPORARY MARKET
Definition: The contemporary segment in Europe targets the mass market, offering cruises of varied duration, at competitive
prices, and appealing to passengers of all ages and income categories (frequently first-time cruise passengers).
HOW TO USE THIS SECTION:
These pages break down the passenger capacity, number of berths per ship and cruise line in each market segment
showing the trends per line each year.
The MSC Meraviglia 1998 1999 2000 2001 2002 2003
35 36 38 37 35 45
Ships: 24,916 25,284 27,363 27,395 30,439 42,767
Berths: 711,441 778,088 745,907 871,257 1,051,524 1,404,553
Market Capacity:
Percentage Change: 9.4% -4.1% 16.8% 20.7% 33.6%
2004 2005 2006 2007 2008 2009
Ships: 48 47 53 54 56 52
Berths:
Market Capacity: 48,503 48,147 55,884 62,834 71,897 79,577
Percentage Change: 1,897,469 1,656,969 1,953,469 2,359,519 2,803,915 3,130,219
35.1% -12.7% 17.9% 20.8% 18.8% 11.6%
Ships:
Berths: 2010 2011 2012 2013 2014 2015
Market Capacity: 50 47 47 46 45 44
Percentage Change:
80,977 83,534 86,373 88,871 91,465 92,845
3,202,828 3,273,708 3,739,544 3,967,470 4,000,312 3,941,811
Ships:
Berths: 2.3% 2.2% 14.2% 6.1% 0.8% -1.5%
Market Capacity:
Percentage Change: 2016 2017 2018 2019 2020 2021
42 47 49 53 54 56
Ships: 87,045 101,663 109,428 127,076 130,764 143,848
Berths: 3,794,338 4,143,624 4,568,244 5,161,316 5,641,982 6,153,274
Market Capacity:
Percentage Change: -3.7% 9.2% 10.2% 13.0% 9.3% 9.1%
2022 2023 2024 2025 2026 2027
57 60 61 62 63 63
149,248 164,096 169,496 174,896 180,296 180,296
6,654,370 7,234,818 7,685,666 7,966,466 8,247,266 8,420,066
8.1% 8.7% 6.2% 3.7% 3.5% 2.1%
Cruise Industry News | 2019 Annual Report 171