Page 30 - 2019 Cruise Industry News Annual Report
P. 30

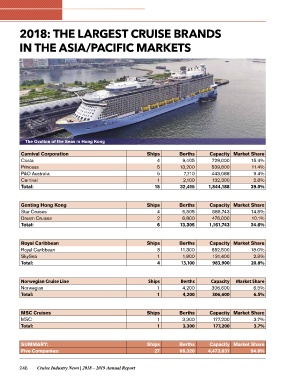
2018: THE LARGEST CRUISE BRANDS
IN THE ASIA/PACIFIC MARKETS

    The Ovation of the Seas in Hong Kong              Ships    Berths   Capacity Market Share
                                                            4   9,405
                                                            5           729,000    15.4%
Carnival Corporation                                        5  13,200
Costa                                                       1    7,710  539,800    11.4%
Princess                                                         2,100
P&O Australia                                             15            443,088    9.4%
Carnival                                                       32,415
Total:                                                Ships             132,300    2.8%
                                                            4
                                                            2           1,844,188  39.0%
                                                            6
Genting Hong Kong                                              Berths   Capacity Market Share
Star Cruises                                          Ships     6,505
Dream Cruises                                               3   6,800   685,743    14.5%
Total:                                                      1
                                                            4  13,305   476,000    10.1%
 
                                                      Ships             1,161,743  24.6%
Royal Caribbean                                             1
Royal Caribbean                                             1  Berths   Capacity Market Share
SkySea                                                         11,300
Total:                                                          1,800   852,500    18.0%
                                                               13,100
                                                                        131,400    2.8%

Norwegian Cruise Line                                                   983,900    20.8%
Norwegian
Total:                                                         Berths   Capacity   Market Share
                                                                4,200   306,600              6.5%
                                                                4,200   306,600               6.5%

MSC Cruises                                           Ships    Berths   Capacity Market Share
MSC                                                         1   3,300
Total:                                                      1    3,300  177,200    3.7%
 
                                                      Ships             177,200    3.7%
                                                          27
SUMMARY:                                                       Berths   Capacity Market Share
Five Companies:                                                66,320
                                                                        4,473,631  94.6%

246 Cruise Industry News | 2018 – 2019 Annual Report
   25   26   27   28   29   30   31   32   33   34   35