Page 28 - 2019 Cruise Industry News Annual Report
P. 28

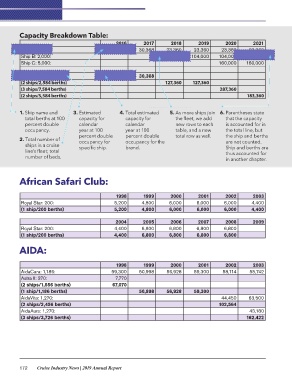
Capacity Breakdown Table:                            2017         2018          2019                       2021
  2016                                             30,368      23,360        23,360           2020       23,360
                                                              104,000       104,000        23,360     (104,000)
Ship A: 584:               30,368                  30,368                                 104,000      160,000
                                                              127,360       127,360       160,000
Ship B: 2,000:

Ship C: 5,000:

(1 ship/584 berths)        30,368
(2 ships/2,584 berths)
(3 ships/7,584 berths)                                                                    287,360
(2 ships/5,584 berths)
                                                                                                      183,360

1. Ship name and       3. Estimated      4. Total estimated   5. A s more ships join  6. Parentheses state
   total berths at 100     capacity for       capacity for          the fleet, we add        that the capacity
   percent double          calendar           calendar              new rows to each         is accounted for in
   occupancy.              year at 100        year at 100           table, and a new         the total line, but
                           percent double     percent double        total row as well.       the ship and berths
2. T otal number of       occupancy for      occupancy for the                              are not counted.
   ships in a cruise       specific ship.     brand.                                         Ship and berths are
   line’s fleet; total                                                                       thus accounted for
   number of beds.                                                                           in another chapter.

African Safari Club:

                                            1998      1999          2000     2001          2002        2003
Royal Star: 200:                            5,200    4,800         6,000     6,000         6,000       4,400
(1 ship/200 berths)                        5,200     4,800         6,000    6,000         6,000       4,400

                                            2004      2005          2006     2007          2008        2009
Royal Star: 200:                            4,400    6,800         6,800     6,800         6,800             
(1 ship/200 berths)                        4,400     6,800         6,800    6,800         6,800
 
                                                      1999          2000
AIDA:                                               50,998        56,928

                              1998                                             2001           2002        2003
AidaCara: 1,186:            59,300                                           59,300         58,114      55,742
Astra II: 370:                                     50,998        56,928
(2 ships/1,556 berths)        7,770                                                                             
(1 ship/1,186 berths)       67,070
AidaVita: 1,270:                                                            59,300         44,450      63,500
(2 ships/2,456 berths)                                                                    102,564
AidaAura: 1,270:                                                                                        43,180
(3 ships/3,726 berths)                                                                                162,422

172 Cruise Industry News | 2019 Annual Report
   23   24   25   26   27   28   29   30   31   32   33