
Page 31 - 2019 Cruise Industry News Annual Report
P. 31
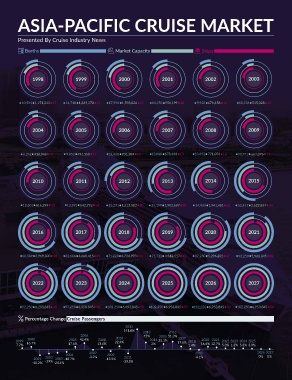
ASIA-PACIFIC CRUISE MARKET

Presented By Cruise Industry News

      Berths                                                  Market Capacity                                          Ships

      1998                                1999                 2000                         2001                        2002             2003

10,581 1,271,212 17  14,718 1,369,278 21 17,996 1,598,026 22 14,258 956,199 18                                         9,928 678,458 12  10,236 515,028 12

      2004                                2005                 2006                         2007                        2008             2009

8,242 418,948 10     9,852 492,568 12                         12,428 701,304 14        13,060 678,664 13         13,492 771,056 12       10,912 667,076 11

      2010                                2011                 2012                         2013                        2014             2015

12,601 816,294 13    12,591 542,793 14                        25,271 1,312,502 20 35,199 1,902,697 28            34,453 1,941,481 26 52,417 2,622,837 34

      2016                                2017                 2018                         2019                        2020             2021

68,389 3,969,303 40 82,666 4,668,415 45 71,228 4,734,993 41 71,722 4,542,517 42 87,250 5,296,201 47 92,250 5,968,845 48

      2022                                2023                 2024                         2025                        2026             2027

92,250 6,283,845 48 97,250 6,358,845 49 102,250 6,693,845 50 102,250 6,953,845 50 102,250 6,953,845 50 102,250 6,953,845 50

      Percentage Change Cruise Passengers

                                                                       2012      2013              2016
                                                                      141.8%
      2000                      2006                                             45%        2015   51.3%  2017
      16.7%          2005 42.4%                               2010                    2014  35.1%         17.6%
1999                 17.6%                             2008   22.4%                                              2018  2020 2021 2022 2023 2024 2025
7.7%                                                   13.6%                            2%                       1.4%  16.6% 12.7% 5.3% 1.2% 5.3% 3.9%

                                    2004        2007    2009    2011                                             2019                                   2026 2027
       2001 2002 2003 -18.7%                    -3.2%  -13.5%  -33.5%                                            -4.1%                                   0% 0%
      -40.2% -29% -24.1%