
Page 22 - 2019 Cruise Industry News Annual Report
P. 22
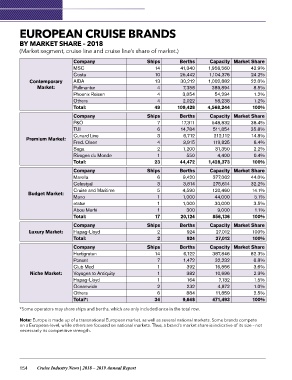
EUROPEAN CRUISE BRANDS

BY MARKET SHARE – 2018

(Market segment, cruise line and cruise line’s share of market.)

                 Company                              Ships     Berths                      Capacity Market Share
                 MSC                                      14    41,340
                 Costa                                    10    25,442                      1,958,560  42.9%
                 AIDA                                     13    30,212
                 Pullmantur                                 4                               1,104,376  24.2%
                 Phoenix Reisen                             4     7,358
Contemporary     Others                                     4     3,054                     1,002,882  22.0%
    Market:      Total:                                   49      2,022
                                                               109,428                      389,894    8.5%

                                                                                            54,294     1.2%

                                                                                            58,238     1.2%

                                                                                            4,568,244  100%

                 Company                              Ships       Berths                    Capacity Market Share
                 P&O                                        7      17,311
                 TUI                                        6     14,784                    548,832    38.4%
                 Cunard Line                                3       6,712
                 Fred. Olsen                                4       3,915                   511,854    35.8%
                 Saga                                       2       1,200
Premium Market:  Rivages du Monde                           1                               212,112    14.8%
                 Total:                                               550
                                                          23      44,472                    119,825    8.4%

                                                                                            31,350     2.2%

                                                                                            4,400      0.4%

                                                                                            1,428,373  100%

                 Company                              Ships       Berths                    Capacity Market Share
                 Marella                                    6       9,420
                 Celestyal                                  3       3,814                   377,062    44.0%
                 Cruise and Maritime                        5      4,590
                 Mano                                       1      1,000                    275,614    32.2%
                 etstur                                     1      1,000
Budget Market:   Abou Merhi                                 1         300                   120,460    14.1%
                 Total:                                   17      20,124
                                                                                            44,000     5.1%

                                                                                            30,000     3.5%

                                                                                            9,000      1.1%

                                                                                            856,136    100%

                 Company                              Ships       Berths                    Capacity Market Share
                 Hapag-Lloyd                                2         924
Luxury Market:   Total:                                     2         924                   27,012     100%

                                                                                            27,012     100%

                 Company                              Ships       Berths                    Capacity Market Share
                 Hurtigruten                              14        6,122
                 Ponant                                     7       1,472                   387,846    82.3%
                 Club Med                                   1         392
                 Voyages to Antiquity                       1         382                   32,232     6.8%
                 Hapag-Lloyd                                1         164
                 Oceanwide                                  2         232                   16,856     3.6%
                 Others                                     6         884
Niche Market:    Total*:                                  34       9,648                    10,696     2.3%

                                                                                            7,132      1.5%

                                                                                            4,872      1.0%

                                                                                            11,859     2.5%

                                                                                            471,493    100%

*Some operators may share ships and berths, which are only included once in the total row.

Note: Europe is made up of a transnational European market, as well as several national markets. Some brands compete
on a European-level, while others are focused on national markets. Thus, a brand’s market share is indicative of its size – not
necessarily its competitive strength.

154 Cruise Industry News | 2018 – 2019 Annual Report