
Page 27 - 2025 Expedition Report
P. 27
EXPEDITION
Market
Market Reports
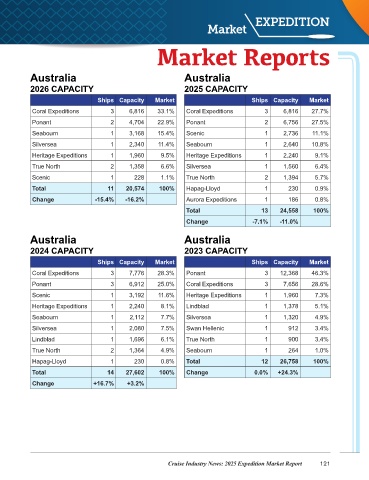
Australia Australia
2026 CAPACITY 2025 CAPACITY
Ships Capacity Market Ships Capacity Market
Coral Expeditions 3 6,816 33.1% Coral Expeditions 3 6,816 27.7%
Ponant 2 4,704 22.9% Ponant 2 6,756 27.5%
Seabourn 1 3,168 15.4% Scenic 1 2,736 11.1%
Silversea 1 2,340 11.4% Seabourn 1 2,640 10.8%
Heritage Expeditions 1 1,960 9.5% Heritage Expeditions 1 2,240 9.1%
True North 2 1,358 6.6% Silversea 1 1,560 6.4%
Scenic 1 228 1.1% True North 2 1,394 5.7%
Total 11 20,574 100% Hapag-Lloyd 1 230 0.9%
Change -15.4% -16.2% Aurora Expeditions 1 186 0.8%
Total 13 24,558 100%
Change -7.1% -11.0%
Australia Australia
2024 CAPACITY 2023 CAPACITY
Ships Capacity Market Ships Capacity Market
Coral Expeditions 3 7,776 28.3% Ponant 3 12,368 46.3%
Ponant 3 6,912 25.0% Coral Expeditions 3 7,656 28.6%
Scenic 1 3,192 11.6% Heritage Expeditions 1 1,960 7.3%
Heritage Expeditions 1 2,240 8.1% Lindblad 1 1,378 5.1%
Seabourn 1 2,112 7.7% Silversea 1 1,320 4.9%
Silversea 1 2,080 7.5% Swan Hellenic 1 912 3.4%
Lindblad 1 1,696 6.1% True North 1 900 3.4%
True North 2 1,364 4.9% Seabourn 1 264 1.0%
Hapag-Lloyd 1 230 0.8% Total 12 26,758 100%
Total 14 27,602 100% Change 0.0% +24.3%
Change +16.7% +3.2%
Cruise Industry News: 2025 Expedition Market Report 121