Description
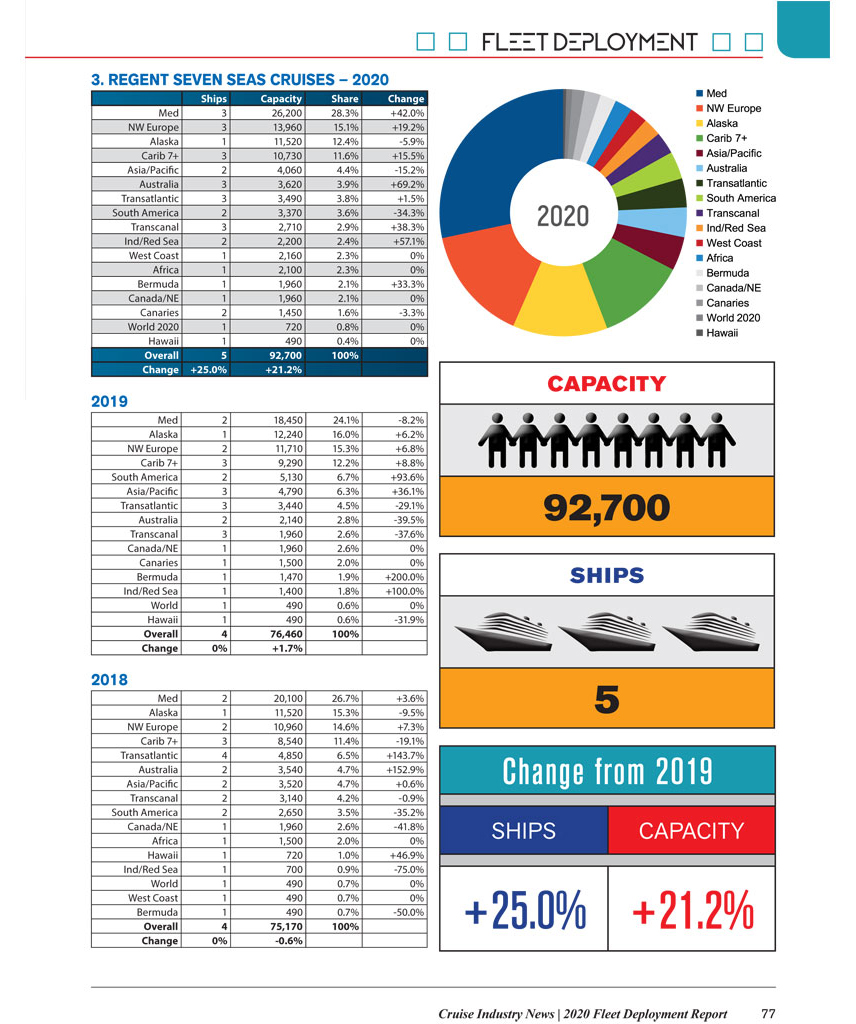
The 93-page 2020 Fleet Deployment Report PDF provides a key capacity breakdown by brand and cruise region for 2020.
Published in October 2019.
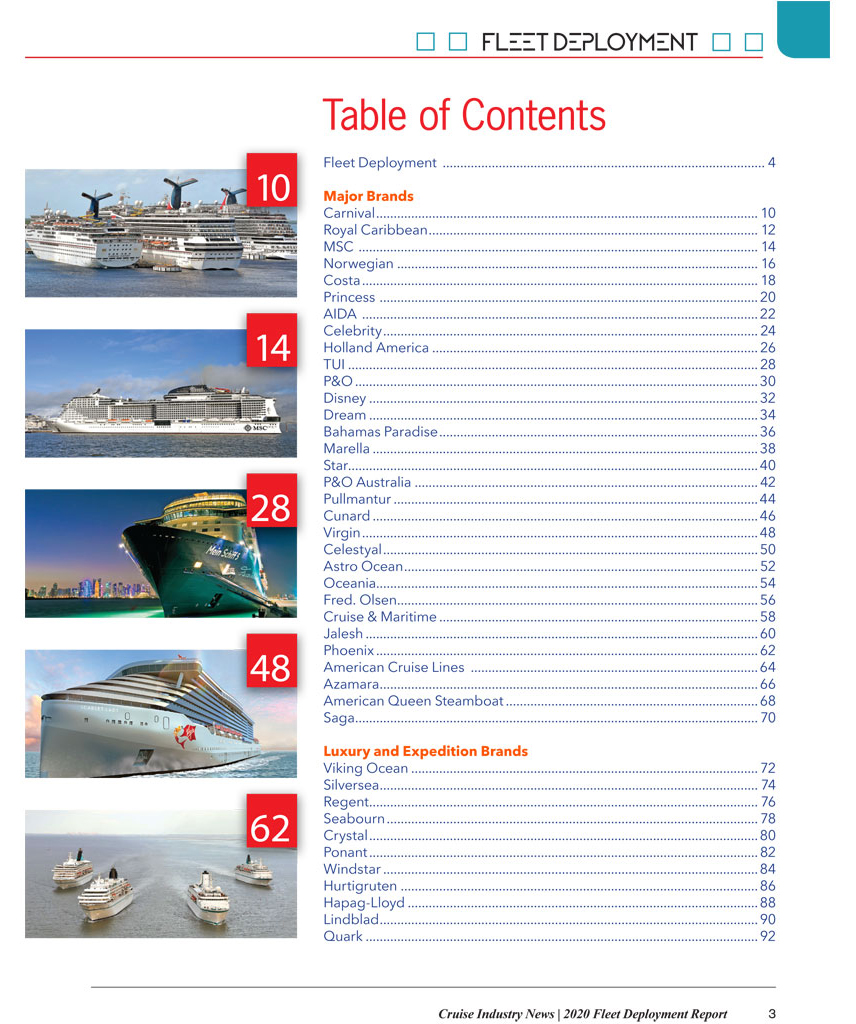
Datasets include each major cruise line as well as key luxury, expedition and niche lines, representing a complete overview of the cruise industry with deployment data on 40 brands.
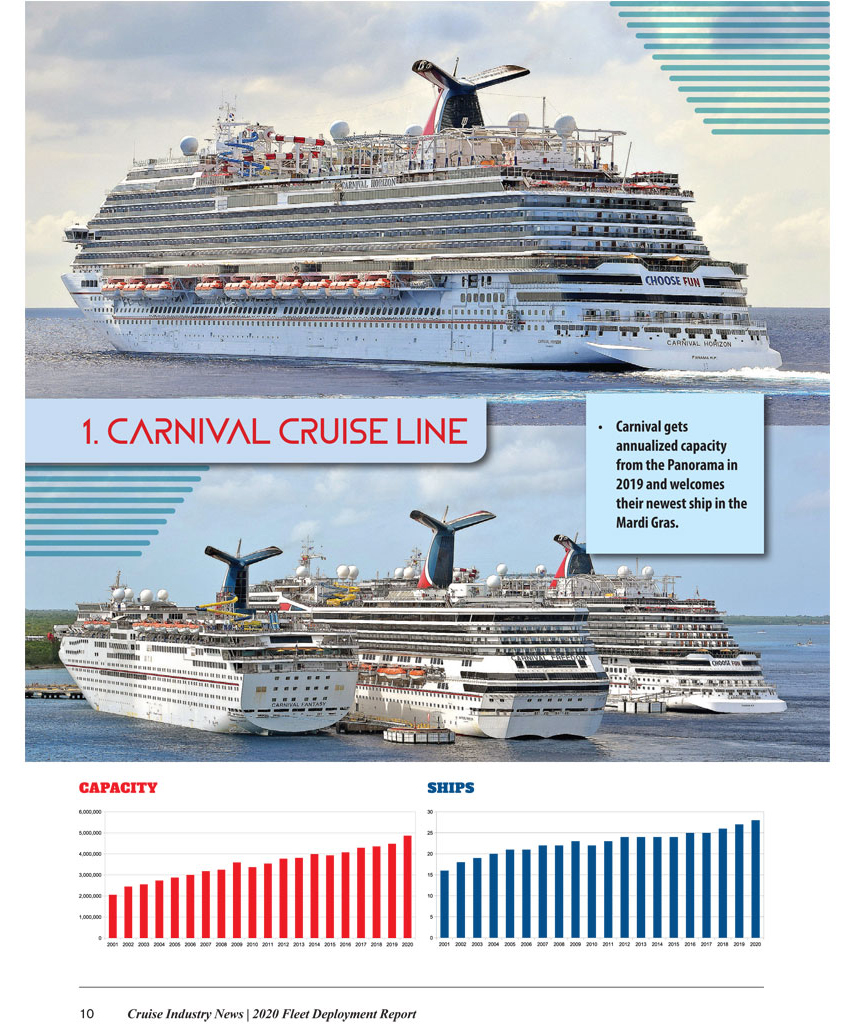
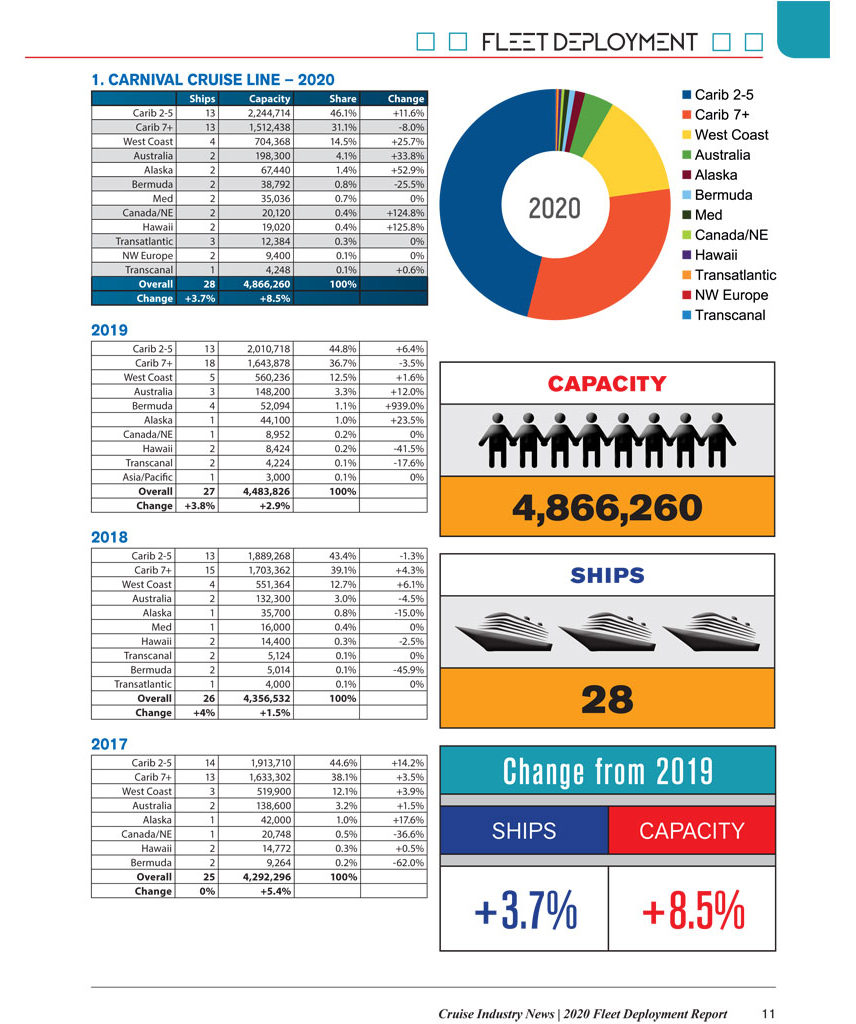
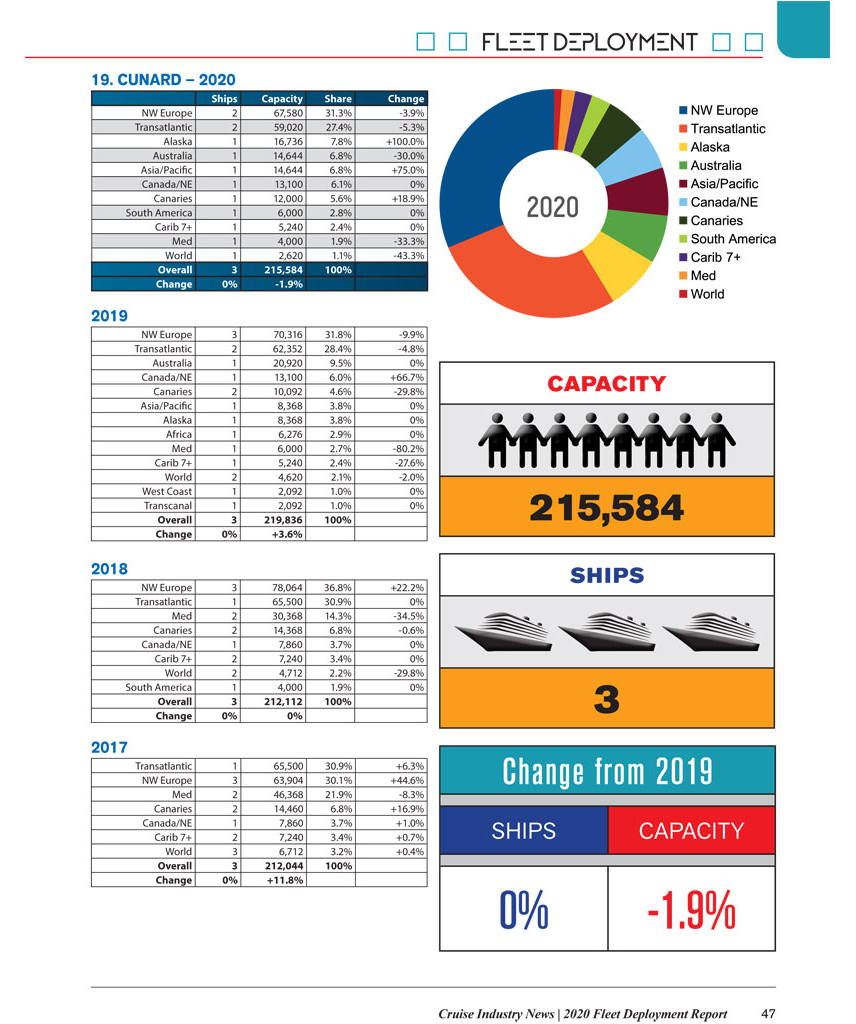
2020 projections are broken down by brand into key sailing regions, showing the number of ships and market capacity for each brand in each sailing region.
It is the only forward-looking, independently-researched brand level deployment data available; with over 40 brands over 200 ships covered.
Click here to see the Table of Contents and Sample Pages.
The 2020 Fleet Deployment Report covers the top 40 cruise brands globally by capacity, including the top luxury and expedition operators by capacity, with data from 2017 through 2020, with each year broken down by sailing region (market) per brand based on independent research from Cruise Industry News.
- Readers will be able to see trends, regional deployment, ship statistics, percent changes and much more.
- Data from 2017 to 2020.
- Broken down by cruise line and sailing region (market) – easy to read and interpret data. See how a cruise line’s deployment has changed by region over three years, by percentage share of its fleet, ship and capacity.
- Original statistics by Cruise Industry News.