
Page 9 - CIN - Annual Report
P. 9
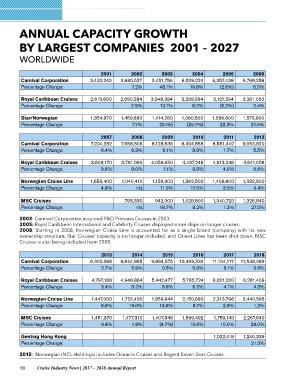
ANNUAL CAPACITY GROWTH
BY LARGEST COMPANIES 2001 – 2027

WORLDWIDE

Carnival Corporation           2001         2002           2003         2004          2005         2006
Percentage Change:       3,432,240    3,680,527      5,451,756    6,529,224     6,357,438    6,769,258

                                            7.2%         48.1%        19.8%         (2.6%)         6.5%

Royal Caribbean Cruises  2,615,600    2,690,284      3,048,284    3,299,294     3,127,294    3,201,550
Percentage Change:                          2.9%          13.1%         8.2%        (5.2%)         2.4%

Star/Norwegian           1,354,970    1,459,680      1,414,280    1,060,500     1,296,800    1,575,900
Percentage Change:                          7.7%         (3.1%)      (25.7%)        22.3%        21.5%

Carnival Corporation           2007         2008           2009          2010         2011          2012
Percentage Change:       7,204,282    7,658,506      8,128,536    8,434,868     8,581,442    9,053,820

                               6.4%         6.3%           6.1%         3.8%          1.7%         5.5%

Royal Caribbean Cruises  3,509,170    3,791,060      4,059,050    4,437,246     4,613,248    4,641,058
Percentage Change:             9.6%         8.0%            7.1%        9.3%          4.0%         0.6%

Norwegian Cruise Line    1,653,400    1,040,410      1,159,900    1,362,500     1,409,600    1,332,800
Percentage Change:             4.9%            n/a       11.5%         17.5%          3.5%         5.4%

MSC Cruises                           793,330        942,000      1,028,500     1,040,720    1,326,840
Percentage Change:                           n/a       18.7%            9.2%          1.2%        27.5%

2003: Carnival Corporation acquired P&O Princess Cruises in 2003.
2005: Royal Caribbean International and Celebrity Cruises deployed more ships on longer cruises.
2008: Starting in 2008, Norwegian Cruise Line is accounted for as a single brand (company) with its new
ownership structure. Star Cruises’ capacity is no longer included, and Orient Lines has been shut down. MSC
Cruises is also being included from 2008.

Carnival Corporation            2013         2014          2015           2016         2017          2018
Percentage Change:       9,300,288    9,844,865      9,894,575    10,469,332    11,104,117   11,538,289

                               2.7%         5.9%           0.5%           5.8%         6.1%          3.9%

Royal Caribbean Cruises  4,797,168    4,948,864      5,442,477    5,782,724     6,021,020    6,281,409
Percentage Change:            3.4%          3.2%           9.9%         6.2%          4.1%         4.3%

Norwegian Cruise Line    1,447,000    1,722,400      1,959,944    2,150,690     2,213,796    2,440,596
Percentage Change:             8.6%       19.0%          13.8%          9.7%          2.9%         1.2%

MSC Cruises              1,451,370    1,477,310      1,407,848    1,599,492     1,759,140    2,267,640
Percentage Change:             9.4%        1.8%          (4.7%)       13.6%         10.0%        29.0%

Genting Hong Kong                                                               1,022,419    1,240,339
Percentage Change:                                                                                21.3%

2015: Norwegian (NCL Holdings) includes Oceania Cruises and Regent Seven Seas Cruises.

18 Cruise Industry News | 2017 – 2018 Annual Report