Page 5 - CIN - Annual Report
P. 5

[ Executive Briefing ]

CRUISE INDUSTRY 2017
                              2.0%
                           2.0%                     38.9%                 3.3%
                           1.3%                                             3.9%
                           1.2%                                              4.3%
                           1.2%                                             9.0%
                           1.2%
                                                                    13.6%
                            0.9%                            15.7%
                           0.5%

                            0.5%
                              0.3%
                                0.1%
                                  0.1%

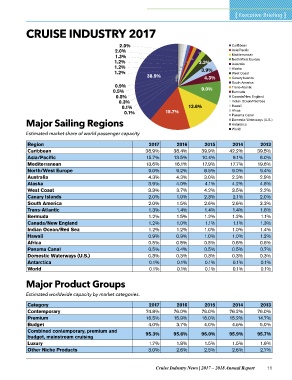
Major Sailing Regions

Estimated market share of world passenger capacity

Region                                                2017    2016    2015           2014               2013
Caribbean                                           38.9%   38.4%   39.9%          42.2%              39.5%
Asia/Pacific                                        15.7%   13.5%   10.4%
Mediterranean                                       13.6%   16.1%   17.9%            9.1%              8.0%
North/West Europe                                                                  17.7%              19.6%
Australia                                            9.0%    9.2%    8.5%           9.0%
Alaska                                               4.3%    4.3%    3.0%           2.3%               9.4%
West Coast                                           3.9%    4.0%     4.1%          4.2%               2.9%
Canary Islands                                       3.3%    3.7%    4.2%           3.5%               4.6%
South America                                        2.0%    1.9%    2.3%            2.1%              2.2%
Trans-Atlantic                                       2.0%    1.5%    2.6%           2.6%               2.0%
Bermuda                                              1.3%    1.4%    1.4%           1.4%               3.3%
Canada/New England                                   1.2%    1.5%    1.2%           1.2%               1.6%
Indian Ocean/Red Sea                                 1.2%    1.0%     1.1%                              1.1%
Hawaii                                               1.2%    1.2%    1.0%            1.1%              1.3%
Africa                                               0.9%    0.9%    1.0%           1.0%               1.4%
Panama Canal                                         0.5%    0.5%    0.5%           1.0%               1.2%
Domestic Waterways (U.S.)                            0.5%    0.4%    0.5%           0.6%               0.6%
Antarctica                                           0.3%    0.3%    0.3%           0.5%               0.7%
World                                                 0.1%    0.1%    0.1%          0.3%               0.3%
                                                      0.1%    0.1%    0.1%           0.1%               0.1%
                                                                                     0.1%               0.1%

Major Product Groups

Estimated worldwide capacity by market categories.

Category                                              2017    2016    2015           2014               2013
Contemporary                                        74.8%   76.0%   76.0%          76.2%              76.0%
Premium                                             16.5%   15.9%   16.0%          15.2%              14.7%
Budget
Combined contemporary, premium and                   4.0%    3.7%    4.0%           4.5%               5.0%
budget, mainstream cruising
Luxury                                              95.3%   95.6%   96.0%          95.9%              95.7%
Other Niche Products
                                                      1.7%   1.8%    1.5%           1.5%               1.6%
                                                     3.0%    2.6%    2.5%           2.6%               2.7%

                                                    Cruise Industry News | 2017 – 2018 Annual Report  11
   1   2   3   4   5   6   7   8   9   10