
Page 8 - CIN - Annual Report
P. 8
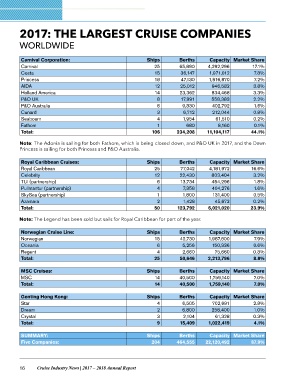
2017: THE LARGEST CRUISE COMPANIES

WORLDWIDE

Carnival Corporation:                                Ships     Berths               Capacity Market Share
Carnival                                                 25    65,890
Costa                                                    15     36,147              4,292,296   17.1%
Princess                                                 18     47,130
AIDA                                                     12     25,012              1,971,012   7.8%
Holland America                                          14    23,362
P&O UK                                                     8    17,991              1,816,870   7.2%
P&O Australia                                              6
Cunard                                                     3     9,330              946,582     3.8%
Seabourn                                                   4     6,712
Fathom                                                     1     1,954              834,468     3.3%
Total:
                                                        106        680              558,383     2.2%
                                                              234,208
                                                                                    402,792     1.6%

                                                                                    212,044     0.8%

                                                                                    61,510      0.2%

                                                                                    8,160       0.1%

                                                                                    11,104,117  44.1%

Note: The Adonia is sailing for both Fathom, which is being closed down, and P&O UK in 2017, and the Dawn
Princess is sailing for both Princess and P&O Australia.

Royal Caribbean Cruises:                             Ships     Berths               Capacity Market Share
Royal Caribbean                                          25    77,042
Celebrity                                                12    22,430               4,181,972   16.6%
TUI (partnership)                                          6   13,734
Pullmantur (partnership)                                   4                        803,404     3.2%
SkySea (partnership)                                       1     7,358
Azamara                                                    2     1,800              454,296     1.8%
Total:                                                   50      1,428
                                                              123,792               404,276     1.6%

                                                                                    131,400     0.5%

                                                                                    45,672      0.2%

                                                                                    6,021,020   23.9%

Note: The Legend has been sold but sails for Royal Caribbean for part of the year.

Norwegian Cruise Line:                               Ships    Berths                Capacity Market Share
Norwegian                                                15   42,730
Oceania                                                    6                        1,987,800   7.9%
Regent                                                     4   5,256
Total:                                                   25    2,660                150,336     0.6%
                                                              50,646
                                                                                    75,660      0.3%

                                                                                    2,213,796   8.8%

MSC Cruises:                                         Ships    Berths                Capacity Market Share
MSC                                                      14   40,500
Total:                                                   14   40,500                1,759,140   7.0%

                                                                                    1,759,140   7.0%

Genting Hong Kong:                                   Ships    Berths                Capacity Market Share
Star                                                       4   6,505
Dream                                                      2   6,800                702,691     2.8%
Crystal                                                    3    2,104
Total:                                                     9                        258,400     1.0%
                                                              15,409
                                                                                    61,328      0.3%

                                                                                    1,022,419   4.1%

SUMMARY:                                             Ships     Berths               Capacity Market Share
Five Companies:                                        204    464,555
                                                                                    22,120,492  87.9%

16 Cruise Industry News | 2017 – 2018 Annual Report