
Page 14 - CIN - Annual Report
P. 14
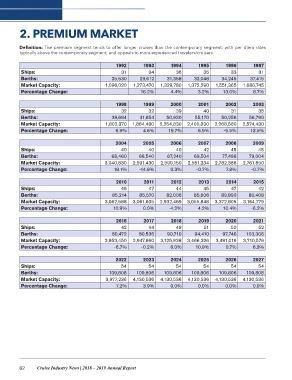
2. PREMIUM MARKET


Definition: The premium segment tends to offer longer cruises than the contemporary segment; with per diem rates
typically above the contemporary segment; and appeals to more experienced travelers/cruisers.

                          1992          1993               1994          1995          1996          1997
Ships:                        31           34                 36            35            33            31
Berths:
Market Capacity:       25,530         29,612             31,358       32,048        34,245         37,415
Percentage Change:  1,096,020     1,273,470          1,329,780     1,372,290     1,551,365     1,686,745

                                      16.2%                4.4%          3.2%        13.0%           8.7%
Ships:
Berths:                   1998          1999               2000          2001          2002          2003
Market Capacity:             32             32                 39            40            31           35
Percentage Change:
                       39,694         41,654             50,930        55,170        50,256        56,790
                    1,802,370     1,884,480          2,254,830     2,400,830     2,268,580     2,574,430
Ships:
Berths:                   6.9%          4.6%              19.7%          6.5%         -5.5%        13.5%
Market Capacity:
Percentage Change:        2004          2005               2006          2007          2008          2009
                              40           40                 40            42             45           45

Ships:                  66,460       66,540              67,240       69,504         77,498       79,004
Berths:             3,040,830     2,591,430          2,599,150     2,581,234     2,782,386     2,761,850
Market Capacity:
Percentage Change:       18.1%        -14.8%               0.3%         -0.7%          7.8%         -0.7%

                           2010         2011               2012           2013          2014         2015
Ships:                        48            47                 44            45            47           42
Berths:
Market Capacity:        85,214        85,570             82,006        85,606        89,890       80,408
Percentage Change:  3,062,588     3,061,605          2,932,469     3,055,848     3,372,805     3,164,779

                         10.9%          0.0%              -4.2%          4.2%         10.4%        -6.2%
Ships:
Berths:                    2016         2017               2018           2019         2020          2021
Market Capacity:              42           44                 49             51           50            52
Percentage Change:
                        80,472       80,536              90,710        94,410        97,746     103,306
                    2,953,450     2,947,860          3,125,938     3,466,326     3,491,016     3,710,576

                         -6.7%         -0.2%               6.0%         10.9%          0.7%          6.3%

                          2022          2023               2024          2025          2026          2027
                             54            54                 54            54            54            54

                      109,806       109,806            109,806       109,806       109,806       109,806
                    3,977,236     4,130,536          4,130,536     4,130,536     4,130,536     4,130,536

                          7.2%          3.9%               0.0%          0.0%          0.0%          0.0%

62 Cruise Industry News | 2018 – 2019 Annual Report