Page 18 - CIN - Annual Report
P. 18

5. NICHE MARKET

 
Definition: The niche segment includes the various cruises that do not generally fit the other categories. The ships cover
the range from old to new and from small to large.

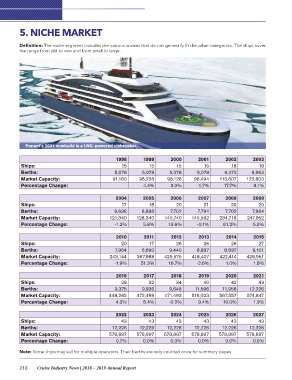
Ponant’s 2021 newbuild is a LNG-powered icebreaker.

                        1998                              1999       2000       2001       2002              2003
Ships:                     15                                15         15         15         18                18
Berths:
Market Capacity:       5,078                             5,078      5,078      5,078      6,473             6,963
Percentage Change:    91,180                           95,228      98,126    96,494    113,607           122,803
 
                        2004                              4.4%       3.0%      -1.7%      17.7%              8.1%
Ships:                     17
Berths:                                                   2005       2006       2007       2008              2009
Market Capacity:       6,638                                 18         20         21         20                20
Percentage Change:  121,340
                                                         6,888      7,702      7,794      7,702             7,964
                       -1.2%                          128,340    145,740    145,592    234,716           247,952
Ships:
Berths:                 2010                              5.8%     13.6%       -0.1%     61.2%               5.6%
Market Capacity:           20
Percentage Change:                                        2011       2012       2013       2014              2015
                       7,964                                 17         26         26         26                27
                    243,144
Ships:                                                   6,690      9,440      8,837      8,837             9,101
Berths:                -1.9%                          367,988    429,575    418,407    422,414           429,951
Market Capacity:
Percentage Change:      2016                            51.3%      16.7%       -2.6%       1.0%              1.8%
                           28
                                                          2017       2018       2019       2020              2021
Ships:                 9,375                                 32         34         40         42                43
Berths:             448,282
Market Capacity:                                         9,936      9,648     11,596     11,956           12,226
Percentage Change:      4.3%                          472,499    471,493    516,003    567,557           574,847

                        2022                              5.4%     -0.2%        9.4%     10.0%               1.3%
                           43
                                                          2023       2024       2025       2026              2027
                      12,226                                 43         43         43         43                43
                    578,897
                                                       12,226     12,226     12,226     12,226            12,226
                        0.7%                          578,897    578,897    578,897    578,897           578,897

                                                          0.0%       0.0%       0.0%       0.0%              0.0%

Note: Some ships may sail for multiple operators. Their berths are only counted once for summary pages.

210 Cruise Industry News | 2018 – 2019 Annual Report
   13   14   15   16   17   18   19   20   21   22   23