Page 27 - 2026 CIN Luxury Market Report
P. 27

Luxury Market                                                                      Luxury Market


                                                               Market Reports


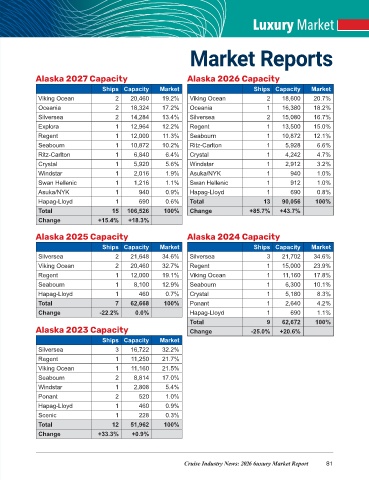
             Alaska 2027 Capacity                             Alaska 2026 Capacity
                                  Ships Capacity     Market                         Ships Capacity     Market
              Viking Ocean             2    20,460    19.2%    Viking Ocean             2    18,600     20.7%
              Oceania                  2    18,324    17.2%    Oceania                  1    16,380     18.2%
              Silversea                2    14,284    13.4%    Silversea                2    15,080     16.7%
              Explora                  1    12,964    12.2%    Regent                   1    13,500     15.0%
              Regent                   1    12,000    11.3%    Seabourn                 1    10,872     12.1%
              Seabourn                 1    10,872    10.2%    Ritz-Carlton             1     5,928      6.6%
              Ritz-Carlton             1     6,840     6.4%    Crystal                  1     4,242      4.7%
              Crystal                  1     5,920     5.6%    Windstar                 1     2,912      3.2%
              Windstar                 1     2,016     1.9%    Asuka/NYK                1       940      1.0%
              Swan Hellenic            1     1,216     1.1%    Swan Hellenic            1       912      1.0%
              Asuka/NYK                1      940      0.9%    Hapag-Lloyd              1       690      0.8%
              Hapag-Lloyd              1      690      0.6%    Total                   13    90,056     100%
              Total                   15   106,526     100%    Change              +85.7%   +43.7%
              Change             +15.4%    +18.3%

             Alaska 2025 Capacity                             Alaska 2024 Capacity

                                  Ships Capacity     Market                         Ships Capacity     Market
              Silversea                2    21,648    34.6%    Silversea                3    21,702     34.6%
              Viking Ocean             2    20,460    32.7%    Regent                   1    15,000     23.9%
              Regent                   1    12,000    19.1%    Viking Ocean             1    11,160     17.8%
              Seabourn                 1     8,100    12.9%    Seabourn                 1     6,300     10.1%
              Hapag-Lloyd              1      460      0.7%    Crystal                  1     5,180      8.3%
              Total                    7    62,668     100%    Ponant                   1     2,640      4.2%
              Change              -22.2%     0.0%              Hapag-Lloyd              1       690      1.1%
                                                               Total                    9    62,672     100%
             Alaska 2023 Capacity                              Change              -25.0%   +20.6%
                                  Ships Capacity     Market
              Silversea                3    16,722    32.2%
              Regent                   1    11,250    21.7%
              Viking Ocean             1    11,160    21.5%
              Seabourn                 2     8,814    17.0%
              Windstar                 1     2,808     5.4%
              Ponant                   2      520      1.0%
              Hapag-Lloyd              1      460      0.9%
              Scenic                   1      228      0.3%
              Total                   12    51,962     100%
              Change             +33.3%     +0.9%


                                                             Cruise Industry News: 2026 6uxury Market Report             81
   22   23   24   25   26   27   28   29   30   31   32