
Description
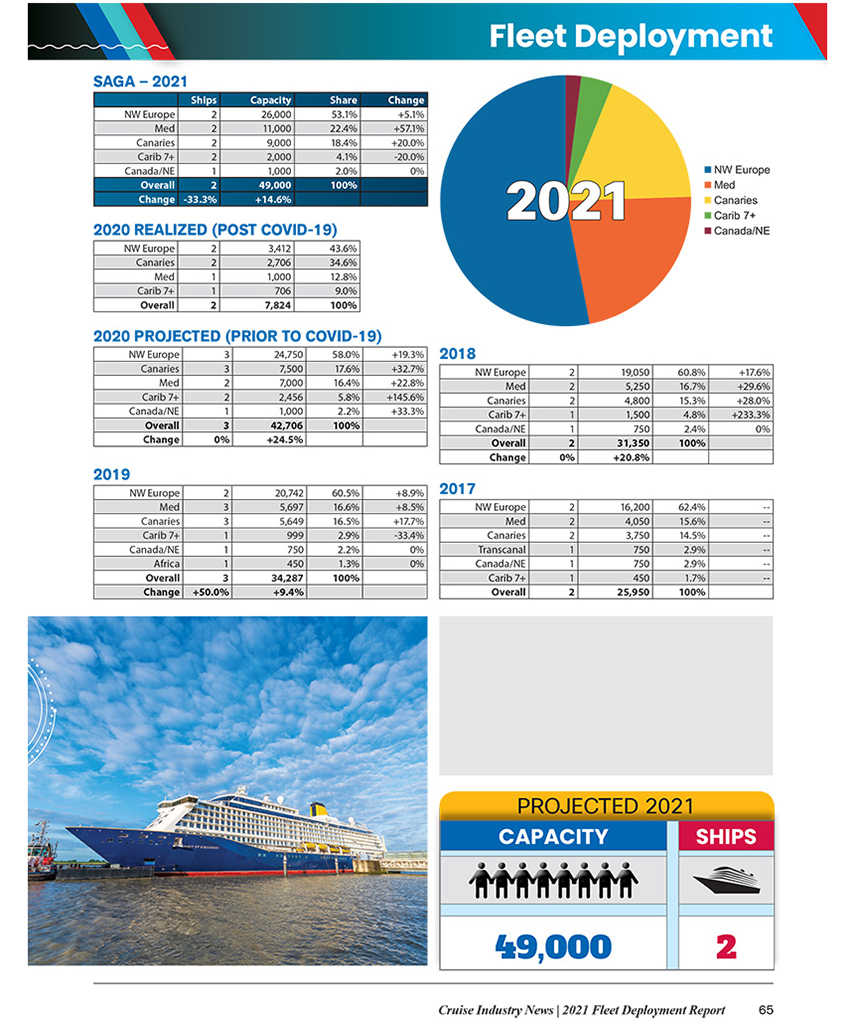
The 97-page 2021 Fleet Deployment Report PDF provides a key capacity breakdown by brand and cruise region for 2021, plus new updated data to reflect COVID-19 effects on 2020 capacity.
Published in October 2020.
Subscribers will also get a first quarter 2021 update of this report.
Datasets include each major cruise line as well as key luxury, expedition and niche lines, representing a complete overview of the cruise industry with deployment data on 40+ brands.
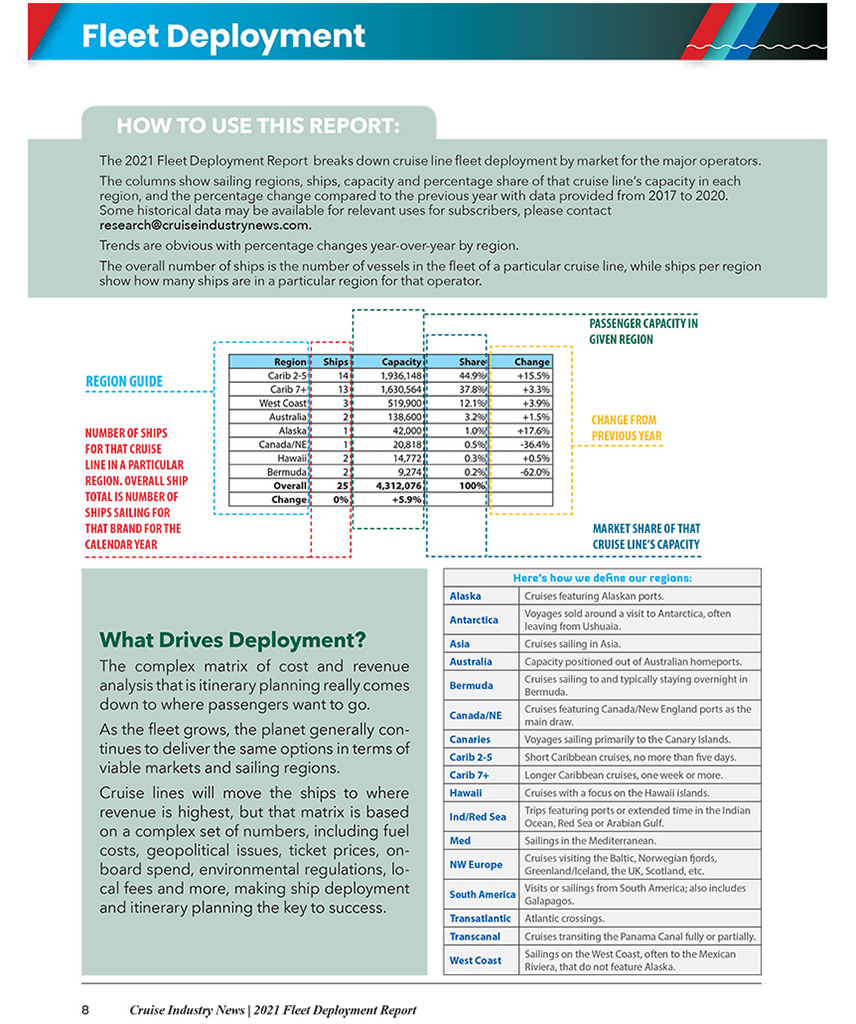
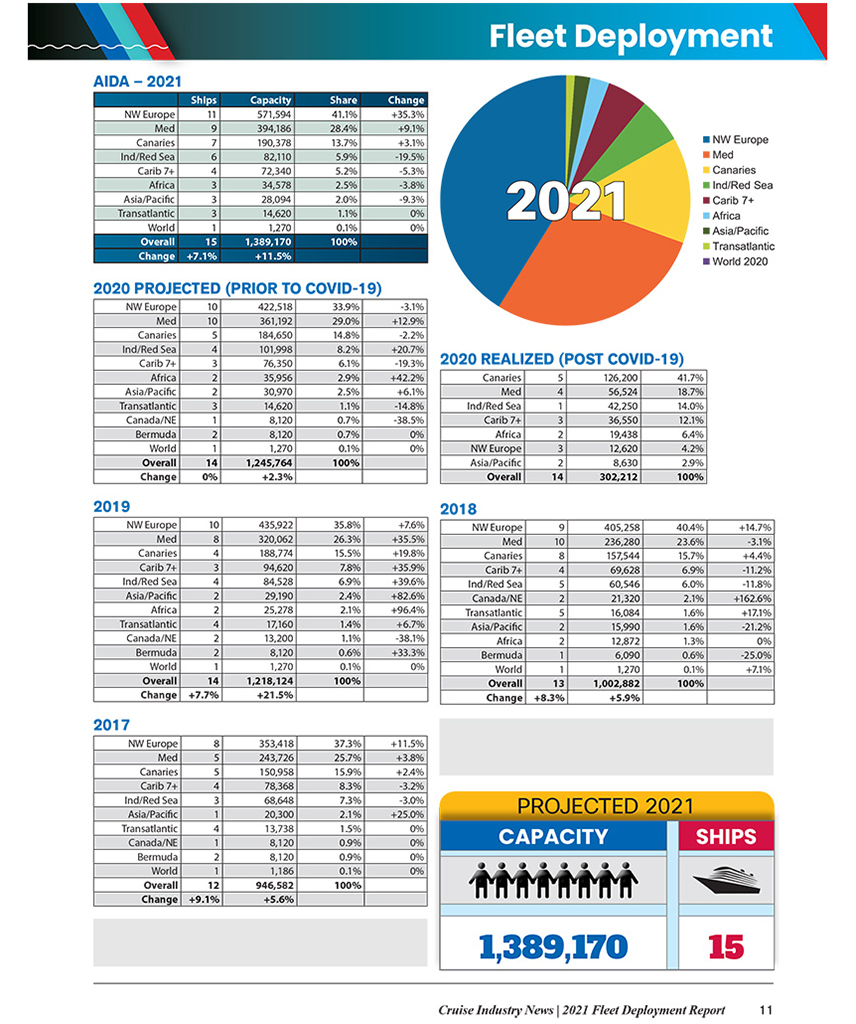
2021 projections are broken down by brand into key sailing regions, showing the number of ships and market capacity for each brand in each sailing region.
It is the only forward-looking, independently-researched brand level deployment data available; with over 40 brands over 200 ships covered.
In addition, all 2020 data has been restated for pre- and post-COVID-19 scenarios. CIN has painted a picture of projected 2020 capacity at the start of 2020, plus realized capacity that was sailed prior to the industry’s voluntary suspension of service in March.
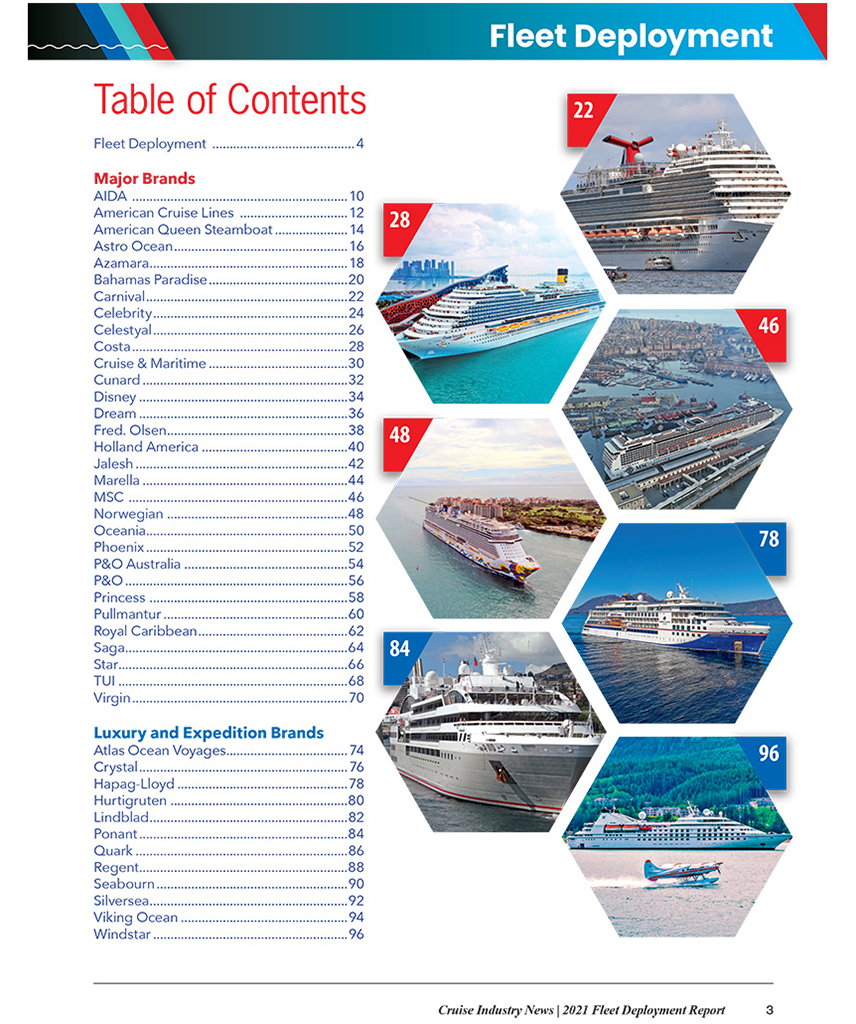
Click here to see the Table of Contents and Sample Pages from last year’s report.
The 2021 Fleet Deployment Report covers the top 40 cruise brands globally by capacity, including the top luxury and expedition operators by capacity, with data from 2018 through 2020, with each year broken down by sailing region (market) per brand based on independent research from Cruise Industry News.
- Readers will be able to see trends, regional deployment, ship statistics, percent changes and much more.
- Data from 2018 to 2021.
- 2020 data now includes projected capacity at the start of the year plus realized capacity (sailed prior to COVID-19).
- Broken down by cruise line and sailing region (market) – easy to read and interpret data. See how a cruise line’s deployment has changed by region over three years, by percentage share of its fleet, ship and capacity.
- Original statistics by Cruise Industry News.
- CIN intends to release an update to this report in Q1 2021 and subscribers are entitled to a copy of it as part of their purchase.