
Page 23 - 2024 CIN Expedition Market Report
P. 23
EXPEDITION Market
Market Reports
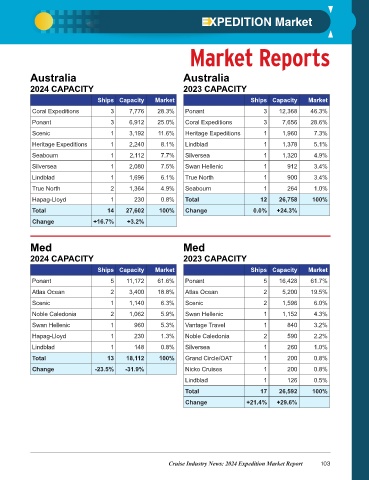
Australia Australia
2024 CAPACITY 2023 CAPACITY
Ships Capacity Market Ships Capacity Market
Coral Expeditions 3 7,776 28.3% Ponant 3 12,368 46.3%
Ponant 3 6,912 25.0% Coral Expeditions 3 7,656 28.6%
Scenic 1 3,192 11.6% Heritage Expeditions 1 1,960 7.3%
Heritage Expeditions 1 2,240 8.1% Lindblad 1 1,378 5.1%
Seabourn 1 2,112 7.7% Silversea 1 1,320 4.9%
Silversea 1 2,080 7.5% Swan Hellenic 1 912 3.4%
Lindblad 1 1,696 6.1% True North 1 900 3.4%
True North 2 1,364 4.9% Seabourn 1 264 1.0%
Hapag-Lloyd 1 230 0.8% Total 12 26,758 100%
Total 14 27,602 100% Change 0.0% +24.3%
Change +16.7% +3.2%
Med Med
2024 CAPACITY 2023 CAPACITY
Ships Capacity Market Ships Capacity Market
Ponant 5 11,172 61.6% Ponant 5 16,428 61.7%
Atlas Ocean 2 3,400 18.8% Atlas Ocean 2 5,200 19.5%
Scenic 1 1,140 6.3% Scenic 2 1,596 6.0%
Noble Caledonia 2 1,062 5.9% Swan Hellenic 1 1,152 4.3%
Swan Hellenic 1 960 5.3% Vantage Travel 1 840 3.2%
Hapag-Lloyd 1 230 1.3% Noble Caledonia 2 590 2.2%
Lindblad 1 148 0.8% Silversea 1 260 1.0%
Total 13 18,112 100% Grand Circle/OAT 1 200 0.8%
Change -23.5% -31.9% Nicko Cruises 1 200 0.8%
Lindblad 1 126 0.5%
Total 17 26,592 100%
Change +21.4% +29.6%
Cruise Industry News: 2024 Expedition Market Report 103