
Page 3 - 2020 China Market Report
P. 3
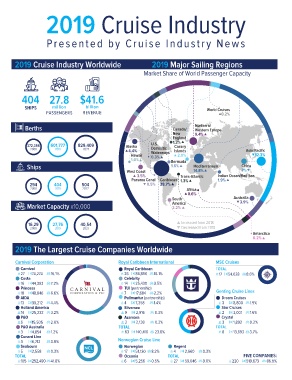
2019 Cruise Industry

         Presented by Cruise Industry News

2019 Cruise Industry Worldwide                2019 Major Sailing Regions

                                            Market Share of World Passenger Capacity

404 27.8 $41.6
SHIPS    million       billion
                                                                                World Cruises
         PASSENGERS REVENUE                                                               0.2%

Berths                                                  Canada/   Northern/
                                                        New       Western Europe
                                                        England   9.4%

372,096  601,777       829,409   Alaska      U.S.       1.2%                                      Asia/Pacific
  2008                            4.4%       Domestic    Canary                                         12.3%
            2019           2027     Hawaii   Waterways   Islands
                                    1.0%     0.3%
                                                           2.0%

Ships                                                   Bermuda                                   China
                                                        1.6% Mediterranean
                                                                  14.8%                           7%
                                 West Coast
                                    3.5%                        Trans-Atlantic       Indian Ocean/Red Sea
294 404                504       Panama Canal      Caribbean    1.3%                 1.9%
                                                   38.7%
2008     2019          2027                0.5%

Market Capacity x10,000                                           Africa                        Australia
                                                                  0.6%                              3.9%
                                                        South
                                                        America
                                                        2.2%

16,29    27,76         40,54                                    Increased from 2018
                                                                Decreased from 2018
 2008      2019          2027

                                                                                                           Antarctica
                                                                                                           0.2%

2019 The Largest Cruise Companies Worldwide

Carnival Corporation             Royal Caribbean International                       MSC Cruises  8.6%
    Carnival                         Royal Caribbean
    27 74,274 16.1%                  26 84,890 16.1%                                 TOTAL
    Costa                            Celebrity                                         17 54,028
    16 44,303 7.2%                   14 25,430 3.5%
    Princess                         TUI (partnership)                               Genting Cruise Lines
    18 48,840 6.6%                   7 17,684 2.2%                                       Dream Cruises
    AIDA                             Pullmantur (partnership)                            3 8,800 1.9%
    13 30,212 4.4%                   4 7,358 1.4%                                        Star Cruises
    Holland America                  Silversea                                           2 3,001 1.6%
    14 25,232 3.2%                   9 2,916 0.3%                                        Crystal
    P&O                              Azamara                                             3 1,892 0.2%
    6 15,505 2.0%                    3 2,138 0.3%
    P&O Australia                                                                    TOTAL
    3 4,854 1.2%                 TOTAL                                                   8 13,693 3.7%
    Cunard Line                      63 140,416 23.8%
    3 6,712 0.8%
    Seabourn                     Norwegian Cruise Line
    5 2,558 0.3%
                                 Norwegian   8.2%           Regent        0.3%
TOTAL                            17 51,130   0.5%           4 2,660                                FIVE COMPANIES:
    105 252,490 41.8%            Oceania                TOTAL
                                 6 5,256                    27 59,046     9.0% 220 519,673 86.9%