
Page 8 - 2019 Cruise Industry News Annual Report
P. 8
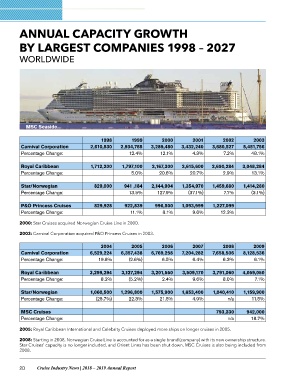
ANNUAL CAPACITY GROWTH
BY LARGEST COMPANIES 1998 – 2027

WORLDWIDE

MSC Seaside

                            1998        1999               2000                     2001        2002          2003
Carnival Corporation  2,610,530   2,934,765          3,289,480               3,432,240    3,680,527     5,451,756
Percentage Change:
                                       12.4%              12.1%                    4.3%         7.2%         48.1%

Royal Caribbean       1,712,200   1,797,100          2,167,300               2,615,600    2,690,284     3,048,284
Percentage Change:                     5.0%              20.6%                   20.7%          2.9%         13.1%

Star/Norwegian        829,000     941 ,184           2,144,904               1,354,970    1,459,680     1,414,280
Percentage Change:                  13.5%               127.9%                  (37.1%)          7.7%        (3.1%)

P&O Princess Cruises  829,928     922,839                          996,500   1,093,999    1,227,099
Percentage Change:                   11.1%                             8.1%        9.6%       12.3%

2000: Star Cruises acquired Norwegian Cruise Line in 2000.                         2007         2008
2003: Carnival Corporation acquired P&O Princess Cruises in 2003.            7,204,282    7,658,506

                            2004        2005               2006                    6.4%         6.3%          2009
Carnival Corporation  6,529,224   6,357,438          6,769,258                                          8,128,536
Percentage Change:
                           19.8%      (2.6%)               6.5%                                               6.1%

Royal Caribbean       3,299,294   3,127,294          3,201,550               3,509,170    3,791,060     4,059,050
Percentage Change:          8.2%      (5.2%)               2.4%                    9.6%         8.0%           7.1%

Star/Norwegian        1,060,500   1,296,800          1,575,900               1,653,400    1,040,410     1,159,900
Percentage Change:       (25.7%)      22.3%               21.5%                    4.9%            n/a       11.5%

MSC Cruises                                                                               793,330       942,000
Percentage Change:                                                                               n/a      18.7%

2005: Royal Caribbean International and Celebrity Cruises deployed more ships on longer cruises in 2005.

2008: Starting in 2008, Norwegian Cruise Line is accounted for as a single brand (company) with its new ownership structure.
Star Cruises’ capacity is no longer included, and Orient Lines has been shut down. MSC Cruises is also being included from
2008.

20 Cruise Industry News | 2018 – 2019 Annual Report