
Page 25 - CIN - Annual Report
P. 25
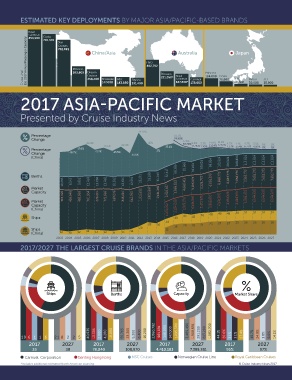
ESTIMATED KEY DEPLOYMENTS BY MAJOR ASIA/PACIFIC-BASED BRANDS
Cruise Line/ Royal Costa
Est. 2017 Annual Passenger Capacity Caribbean 791,370
859,900
Star China/Asia Australia Japan
Cruises
702,691
P&O
402,792
Princess Dream Princess Princess
303,800 Cruises 231,050* 124,000 Costa
258,400
Norwegian MSC SkySea Royal Carnival 76,080 NYK Mitsui JCL
143,080 131,400 Caribbean 40,720 30,000 25,000
147,000
187,800* 138,600
2017 ASIA PACIFIC MARKET
Presented by Cruise Industry News
141.8%
Percentage 51.3%
Change 74.99%
Percentage 17.6%
Change 42.4% 22.4% 45% 33.78% 9.4% 2.3% 14.8% 11.1% 4.7% 1.1% 4.7% 3.5% 0% 0%
(China) 2% 15.45% 1.10% 11.14% 17.67% 7.33% 1.54% 6.77% 4.92% 0% 0%
13.6% 35.1%
17.6%
-3.2%
-18.7% -13.5%
-33.5%
7,058,773 108,824 7,393,773 113,824 7,653,773 113,824 7,653,773 113,824 7,653,773 113,824
Berths 515,028 10,236 418,948 8,242 492,568 9,852 701,304 12,428 678,664 13,060 667,076 10,912 816,294 12,601 542,793 12,591 1,312,502 25,271 1,902,697 35,199 1,941,481 34,453 1,271,052 2,622,837 52,417 2,224,058 3,969,303 68,389 2,975,270 4,668,415 82,666 3,435,070 5,105,073 78,224 3,472,870 5,224,773 89,624 6,001,373 98,824 6,668,773 103,824 6,983,773 103,824
771,056 13,492
Market 4,541,870 4,874,670 4,949,670 5,284,670 5,544,670 5,544,670 5,544,670
Capacity
Market 3,859,870
Capacity
(China) 40 45 43 46 48 49 49 50 51 51 51 51
Ships
34 20 20 21 23 24 24 25 26 26 26 26
Ships 28 26
(China) 20 18
12
12 12 14 13 12 13 14
10 11
2003 2004 2005 2006 2007 2008 2009 2010 2011 2012 2013 2014 2015 2016 2017 2018 2019 2020 2021 2022 2023 2024 2025 2026 2027
2017/2027 THE LARGEST CRUISE BRANDS IN THE ASIA/PACIFIC MARKETS
Ships Berths Capacity Market Share
19 6 1 1 6 21 8 2 2 5 40,535
13,305
2017 2027 2,000
4,200
33 38 18,000
55,765
23,305
5,300
8,400
16,200
2,060,792
961,091
146,000
147,000
1,095,300
3,489,490
1,908,691
291,200
613,200
1,082,700
44.1%
20.6%
3.1%
3.1%
23.4%
45.7%
24.9%
3.8%
8.0%
14.1%
2017 2027 2017 2027 2017 2027
78,040 108,970 4,410,183 7,385,281 95% 97%
Carnival Corporation Genting Hong Kong MSC Cruises Norwegian Cruise Line Royal Caribbean Cruises
*Includes additional estimated North American sourcing. © Cruise Industry News 2017