
Page 24 - CIN - Annual Report
P. 24
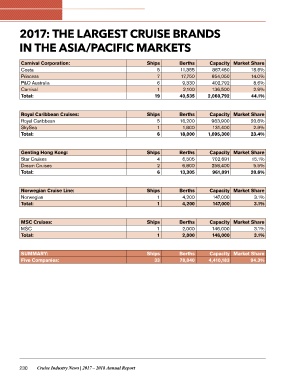
2017: THE LARGEST CRUISE BRANDS
IN THE ASIA/PACIFIC MARKETS

Carnival Corporation:                                 Ships    Berths   Capacity Market Share
Costa                                                       5  11,355
Princess                                                    7  17,750   867,450    18.6%
P&O Australia                                               6   9,330
Carnival                                                    1           654,050    14.0%
Total:                                                           2,100
                                                          19   40,535   402,792    8.6%

                                                                        136,500    2.9%

                                                                        2,060,792  44.1%

Royal Caribbean Cruises:                              Ships    Berths   Capacity Market Share
Royal Caribbean                                             5  16,200
SkySea                                                      1           963,900    20.6%
Total:                                                      6   1,800
                                                               18,000   131,400    2.8%

                                                                        1,095,300  23.4%

Genting Hong Kong:                                    Ships    Berths   Capacity Market Share
Star Cruises                                                4   6,505
Dream Cruises                                               2   6,800   702,691    15.1%
Total:                                                      6
                                                               13,305   258,400    5.5%

                                                                        961,091    20.6%

Norwegian Cruise Line:                                Ships    Berths   Capacity Market Share
Norwegian                                                   1   4,200
Total:                                                      1   4,200   147,000    3.1%

                                                                        147,000    3.1%

MSC Cruises:                                          Ships    Berths   Capacity Market Share
MSC                                                         1   2,000
Total:                                                      1   2,000   146,000    3.1%

                                                                        146,000    3.1%

SUMMARY:                                              Ships    Berths   Capacity Market Share
Five Companies:                                           33   78,040
                                                                        4,410,183  94.3%

230 Cruise Industry News | 2017 – 2018 Annual Report