
Page 37 - 2019 Cruise Industry News Annual Report
P. 37
[ Market Reports ]
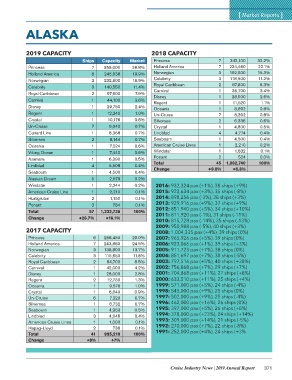
ALASKA
2019 CAPACITY Ships Capacity Market 2018 CAPACITY 7 342,100 32.2%
7 355,000 28.8% 7 234,460 22.1%
8 245,638 19.9% Princess 3 162,600 15.3%
Princess 3 232,800 18.9% Holland America 3 118,500 11.2%
Holland America 3 140,550 11.4% Norwegian 2 8.3%
Norwegian 2 Celebrity 1 87,800 3.4%
Celebrity 1 97,600 7.9% Royal Caribbean 1 35,700 2.6%
Royal Caribbean 1 44,100 3.6% Carnival 1 28,000
Carnival 1 29,750 2.4% Disney 1 11,520 1.1%
Disney 1 12,240 1.0% Regent 7 0.8%
Regent 7 10,176 0.8% Oceania 2 8,892 0.8%
Crystal 1 9,040 0.7% Un-Cruise 1 8,392 0.6%
Un-Cruise 2 8,368 0.7% Silversea 4 6,336 0.5%
Cunard Line 1 0.7% Crystal 1 4,800 0.4%
Silversea 1 8,144 0.6% Lindblad 1 4,774 0.4%
Oceania 1 7,524 0.6% Seabourn 1 4,500 0.2%
Viking Ocean 4 7,440 0.5% American Cruise Lines 2 2,210 0.1%
Azamara 1 6,390 0.4% Windstar 45 1,632 0.0%
Lindblad 5 5,508 0.4% Ponant +9.8% 100%
Seabourn 1 4,500 0.2% Total 524
Alaskan Dream 1 2,579 0.2% Change 1,062,740
Windstar 2 2,244 0.1%
American Cruise Line 3 2,210 0.1% +6.8%
Hurtigruten 1,150 0.1%
Ponant 57 100% 2016: 932,324 pax (+1%), 38 ships (+9%)
Total +26.7% 784 2015: 923,634 pax (+3%), 35 ships (-8%)
Change 1,233,735 2014: 898,256 pax (-3%), 38 ships (+3%)
2013: 929,916 pax (+9%), 37 ships (+9%)
+16.1% 29.0% 2012: 851.940 pax (+5%), 34 ships (+10%)
24.5% 2011: 811,920 pax (-1%), 31 ships (-11%)
2017 CAPACITY 6 288,450 13.7% 2010: 815,728 pax (-14%), 35 ships (-13%)
7 243,880 11.6% 2009: 950,988 pax (-5%), 40 ships (+3%)
Princess 3 136,800 2008: 1,004,335 pax (+4%), 39 ships (0%)
Holland America 3 115,650 8.5% 2007: 965,926 pax (+5%), 39 ships (0%)
Norwegian 2 4.2% 2006: 923,066 pax (+1%), 39 ships (+3%)
Celebrity 1 84,700 2.8% 2005: 911,723 pax (+7%), 38 ships (0%)
Royal Caribbean 1 42,000 1.3% 2004: 851,697 pax (+7%), 38 ships (-5%)
Carnival 2 28,000 1.0% 2003: 797,516 pax (+5%), 40 ships (+38%)
Disney 1 12,730 0.9% 2002: 756,868 pax (+7%), 29 ships (+7%)
Regent 1 0.7% 2001: 704,868 pax (+11%), 27 ships (+8%)
Oceania 6 9,576 0.7% 2000: 633,510 pax (+11%), 25 ships (+4%)
Crystal 1 8,640 0.5% 1999: 571,000 pax (+5%), 24 ships (-4%)
Un-Cruise 1 7,320 0.4% 1998: 545,000 pax (+9%), 25 ships (0%)
Silversea 3 6,732 0.1% 1997: 502,000 pax (+9%), 25 ships (-4%)
Seabourn 1 4,950 0.1% 1996: 462,000 pax (+16%), 26 ships (0%)
Lindblad 2 4,046 100% 1995: 397,000 pax (+5%), 26 ships (+8%)
American Cruise Lines 41 1,000 1994: 378,000 pax (+23%), 24 ships (+14%)
Hapag-Lloyd +8% 1993: 309,000 pax (+14%), 21 ships (-5%)
Total 736 1992: 270,000 pax (+7%), 22 ships (-8%)
Change 995,210 1991: 252,000 pax (+4%), 24 ships (+3%
+7%
Cruise Industry News | 2019 Annual Report 371