
Page 14 - 2019 Cruise Industry News Annual Report
P. 14
2018: THE LARGEST CRUISE BRANDS
IN THE NORTH AMERICAN MARKET
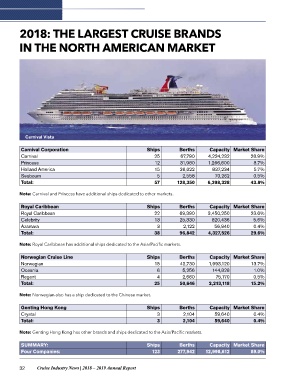
Carnival Vista
Carnival Corporation Ships Berths Capacity Market Share
Carnival 25 67,790 4,224,232 28.9%
Princess 12 31,980 1,266,600 8.7%
Holland America 15 26,022 837,234 5.7%
Seabourn 5 2,558 70,262 0.5%
Total: 57 128,350 6,398,328 43.8%
Note: Carnival and Princess have additional ships dedicated to other markets.
Royal Caribbean Ships Berths Capacity Market Share
Royal Caribbean 22 69,390 3,450,250 23.6%
Celebrity 13 25,330 820,436 5.6%
Azamara 3 2,122 56,840 0.4%
Total: 38 96,842 4,327,526 29.6%
Note: Royal Caribbean has additional ships dedicated to the Asia/Pacific markets.
Norwegian Cruise Line Ships Berths Capacity Market Share
Norwegian 15 42,730 1,993,120 13.7%
Oceania 6 5,256 144,828 1.0%
Regent 4 2,660 75,170 0.5%
Total: 25 50,646 2,213,118 15.2%
Note: Norwegian also has a ship dedicated to the Chinese market.
Genting Hong Kong Ships Berths Capacity Market Share
Crystal 3 2,104 59,640 0.4%
Total: 3 2,104 59,640 0.4%
Note: Genting Hong Kong has other brands and ships dedicated to the Asia/Pacific markets.
SUMMARY: Ships Berths Capacity Market Share
Four Companies: 123 277,942
12,998,612 89.0%
32 Cruise Industry News | 2018 – 2019 Annual Report