
Page 18 - 2025 Expedition Report
P. 18
EXPEDITION
Market
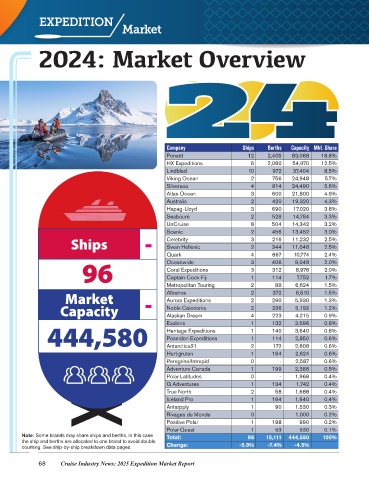
2024: Market Overview
Company Ships Berths Capacity Mkt. Share
Ponant 12 2,405 83,068 18.8%
HX Expeditions 6 2,080 54,970 12.5%
Lindblad 10 972 37,404 8.5%
Viking Ocean 2 756 24,948 5.7%
Silversea 4 814 24,490 5.6%
Atlas Ocean 3 600 21,800 4.9%
Australis 2 420 19,320 4.3%
Hapag-Lloyd 3 690 17,020 3.8%
Seabourn 2 528 14,784 3.3%
UnCruise 8 504 14,342 3.2%
Scenic 2 456 13,452 3.0%
Ships - Celebrity 3 344 11,232 2.5%
216
Swan Hellenic
2
2.5%
11,048
Quark 4 406 10,774 2.4%
667
96 Coral Expeditions 3 312 8,976 2.0%
9,048
2.0%
3
Oceanwide
Captain Cook Fiji
114
7,752
1
1.7%
Metropolitan Touring 2 88 6,624 1.5%
6,510
Market - Albatros 2 372 5,930 1.5%
1.3%
290
2
Aurora Expeditions
Capacity Noble Caledonia 2 236 5,192 1.2%
4,215
Alaskan Dream
4
0.9%
223
444,580 Exploris 1 132 3,696 0.8%
1
Heritage Expeditions
3,640
0.8%
140
114
2,850
0.6%
Poseidon Expeditions
1
Antarctica21
164
Hurtigruten 2 172 2,808 0.6%
2,624
0.6%
1
Peregrine/Intrepid 0 - 2,587 0.6%
Adventure Canada 1 199 2,388 0.5%
Polar Latitudes 0 - 1,968 0.4%
G Adventures 1 134 1,742 0.4%
True North 2 58 1,688 0.4%
Iceland Pro 1 164 1,640 0.4%
Antarpply 1 90 1,530 0.3%
Rivages du Monde 0 1,000 0.2%
Positive Polar 1 198 990 0.2%
Polar Quest 1 53 530 0.1%
Note: Some brands may share ships and berths, in this case Total: 96 15,111 444,580 100%
the ship and berths are allocated to one brand to avoid double
counting. See ship-by-ship breakdown data pages. Change: -5.9% -7.4% -4.5%
68 Cruise Industry News: 2025 Expedition Market Report