
Page 14 - 2023 Expedition Market Report
P. 14
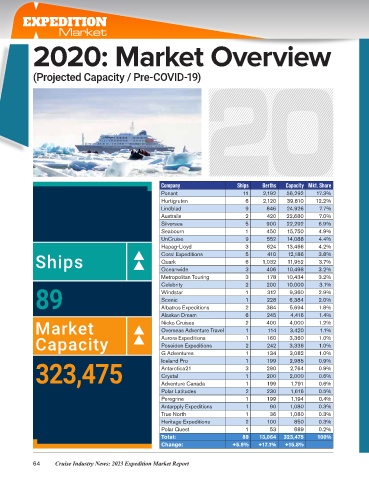
EXPEDITION
Market
2020: Market Overview
(Projected Capacity / Pre-COVID-19)
Company Ships Berths Capacity Mkt. Share
Ponant 11 2,192 56,292 17.3%
Hurtigruten 6 2,120 39,810 12.2%
Lindblad 9 846 24,926 7.7%
Australis 2 420 22,680 7.0%
Silversea 5 900 22,292 6.9%
Seabourn 1 450 15,750 4.9%
UnCruise 9 552 14,088 4.4%
Hapag-Lloyd 3 624 13,466 4.2%
Ships Coral Expeditions 5 1,032 12,186 3.8%
410
Quark
3.7%
11,952
6
Oceanwide
10,498
10,434
3.2%
3
Metropolitan Touring 3 406 10,000 3.2%
178
89 Windstar 1 228 9,360 2.9%
3.1%
200
Celebrity
2
312
2.0%
Scenic
1
6,384
Albatros Expeditions
Alaskan Dream 2 384 5,694 1.8%
245
6
1.4%
4,416
Market Nicko Cruises 2 400 4,000 1.2%
1
1.1%
Overseas Adventure Travel
3,420
114
Capacity Aurora Expeditions 1 160 3,360 1.0%
242
1.0%
Poseidon Expeditions
3,336
2
G Adventures 1 134 3,082 1.0%
323,475 Antarctica21 3 290 2,000 0.9%
0.9%
Iceland Pro
1
199
2,985
2,764
1
0.6%
Crystal
200
Adventure Canada
1,616
Polar Latitudes 1 199 1,791 0.6%
0.5%
2
230
Peregrine 1 199 1,194 0.4%
Antarpply Expeditions 1 90 1,080 0.3%
True North 1 36 1,080 0.3%
Heritage Expeditions 2 100 850 0.3%
Polar Quest 1 53 689 0.2%
Total: 89 13,064 323,475 100%
Change: +5.9% +17.1% +15.8%
64 Cruise Industry News: 2023 Expedition Market Report