
Page 27 - 2023 Cruise Industry News Annual Report
P. 27
[ Market Reports ]
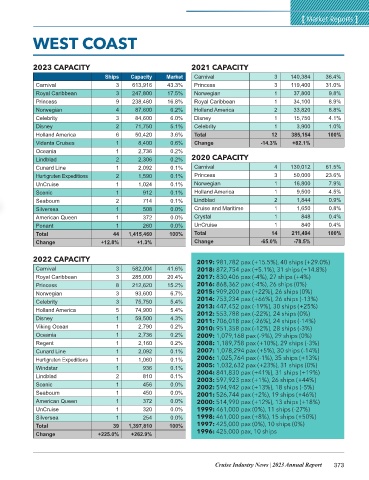
WEST COAST
2023 CAPACITY 2021 CAPACITY
Ships Capacity Market Carnival 3 140,384 36.4%
Carnival 3 613,916 43.3% Princess 3 119,400 31.0%
Royal Caribbean 3 247,800 17.5% Norwegian 1 37,800 9.8%
Princess 9 238,460 16.8% Royal Caribbean 1 34,100 8.9%
Norwegian 4 87,600 6.2% Holland America 2 33,820 8.8%
Celebrity 3 84,600 6.0% Disney 1 15,750 4.1%
Disney 2 71,750 5.1% Celebrity 1 3,900 1.0%
Holland America 6 50,420 3.6% Total 12 385,154 100%
Vidanta Cruises 1 8,400 0.6% Change -14.3% +82.1%
Oceania 1 2,736 0.2%
Lindblad 2 2,306 0.2% 2020 CAPACITY
Cunard Line 1 2,092 0.1% Carnival 4 130,012 61.5%
Hurtigruten Expeditions 2 1,590 0.1% Princess 3 50,000 23.6%
UnCruise 1 1,024 0.1% Norwegian 1 16,800 7.9%
Scenic 1 912 0.1% Holland America 1 9,500 4.5%
Seabourn 2 714 0.1% Lindblad 2 1,844 0.9%
Silversea 1 508 0.0% Cruise and Maritime 1 1,650 0.8%
American Queen 1 372 0.0% Crystal 1 848 0.4%
Ponant 1 260 0.0% UnCruise 1 840 0.4%
Total 44 1,415,460 100% Total 14 211,494 100%
Change +12.8% +1.3% Change -65.0% -78.5%
2022 CAPACITY
2019: 981,782 pax (+15.5%), 40 ships (+29.0%)
Carnival 3 582,004 41.6% 2018: 872,754 pax (+5.1%), 31 ships (+14.8%)
Royal Caribbean 3 285,000 20.4% 2017: 830,406 pax (-4%), 27 ships (+4%)
Princess 8 212,620 15.2% 2016: 868,362 pax (-4%), 26 ships (0%)
Norwegian 3 93,600 6.7% 2015: 909,200 pax (+22%), 26 ships (0%)
Celebrity 3 75,750 5.4% 2014: 753,234 pax (+66%), 26 ships (-13%)
2013: 447,452 pax (-19%), 30 ships (+25%)
Holland America 5 74,900 5.4%
Disney 1 59,500 4.3% 2012: 553,788 pax (-22%), 24 ships (0%)
2011: 706,018 pax (-26%), 24 ships (-14%)
Viking Ocean 1 2,790 0.2% 2010: 951,358 pax (-12%), 28 ships (-3%)
Oceania 1 2,736 0.2% 2009: 1,079,168 pax (-9%), 29 ships (0%)
Regent 1 2,160 0.2% 2008: 1,189,758 pax (+10%), 29 ships (-3%)
Cunard Line 1 2,092 0.1% 2007: 1,078,294 pax (+5%), 30 ships (-14%)
Hurtigruten Expeditions 1 1,060 0.1% 2006: 1,025,764 pax (-1%), 35 ships (+13%)
Windstar 1 936 0.1% 2005: 1,032,632 pax (+23%), 31 ships (0%)
2004: 841,830 pax (+41%), 31 ships (+19%)
Lindblad 2 810 0.1%
Scenic 1 456 0.0% 2003: 597,923 pax (+1%), 26 ships (+44%)
2002: 594,942 pax (+13%), 18 ships (-5%)
Seabourn 1 450 0.0% 2001: 526,744 pax (+2%), 19 ships (+46%)
American Queen 1 372 0.0% 2000: 514,990 pax (+12%), 13 ships (+18%)
UnCruise 1 320 0.0% 1999: 461,000 pax (0%), 11 ships (-27%)
Silversea 1 254 0.0% 1998: 461,000 pax (+8%), 15 ships (+50%)
Total 39 1,397,810 100% 1997: 425,000 pax (0%), 10 ships (0%)
Change +225.0% +262.9% 1996: 425,000 pax, 10 ships
Cruise Industry News | 2023 Annual Report 373